How to Build a Trade Promotions Management Platform, Scheme Design, Claim Validation, ROI Analytics, and Trade Spend Intelligence 2026


Create engaging, high-performance mobile applications tailored to your business needs. We craft future-ready apps that offer smooth user experiences on all devices.
Build robust and scalable websites and CMS platforms that help you manage content effortlessly. Our development ensures a seamless digital presence.
Launch secure, feature-rich online stores with intuitive shopping experiences. We build tailored eCommerce platforms designed for growth.
Design captivating games with immersive gameplay and stunning graphics. From concept to launch, we build engaging experiences that players love.
Enhance your customer relationships with customized Salesforce implementations. Drive growth and efficiency with smarter CRM solutions.
Harness artificial intelligence and machine learning to automate workflows and gain actionable insights. Our AI transforms data into smart decisions.
Accelerate your software delivery lifecycle with continuous integration, delivery, and infrastructure automation to boost efficiency.
FMCG companies spend 15 to 25% of gross revenue on trade promotions. In a company with ₹1,000 crore in revenue, that is ₹150 to 250 crore per year going into distributor schemes, retailer discounts, volume rebates, shelf placement fees, and display funding. Most of it is managed through spreadsheets and gut instinct. Most companies cannot tell you which 60% of their trade spend is working and which 40% is not.
A Trade Promotions Management (TPM) platform answers the question that matters: for every rupee invested in trade promotion, what is the incremental volume and margin generated?
It does this by connecting the promotional plan, what was offered, to whom, at what cost, with the execution data, what was actually claimed, what volume was generated, and with the outcome data, what the market share and sales velocity looked like during and after the promotion.
The global TPM market is projected to reach $10.24 billion by 2030. The buyers are large FMCG manufacturers, regional beverage companies, and consumer goods brands spending significant revenue on channel incentives without the analytics to prove it is working.
EngineerBabu built supply chain and distribution intelligence for Simba Beer and enterprise operations for Adani Group. CMMI Level 5. Google AI Accelerator 2024 Top 20. Contact: mayank@engineerbabu.com
| Function | Module |
| Promotional planning | Annual trade spend budget, plan creation, approval workflow |
| Scheme design | Scheme types, eligibility rules, rate configuration |
| Promotional calendar | Timeline, channel, geography, SKU mapping |
| Scheme communication | Automated distribution to distributors and field team |
| Execution tracking | Field confirmation of display, POSM, scheme uptake |
| Claims management | Distributor claim submission, validation, credit note |
| Post-event analysis | Volume lift, ROI calculation, market share impact |
| Trade spend analytics | ROI by scheme type, channel, geography, customer |
| Forecast and simulation | Predict volume lift from proposed promotion |
| Integration | DMS, field force app, secondary sales data |
The annual trade spend planning process:
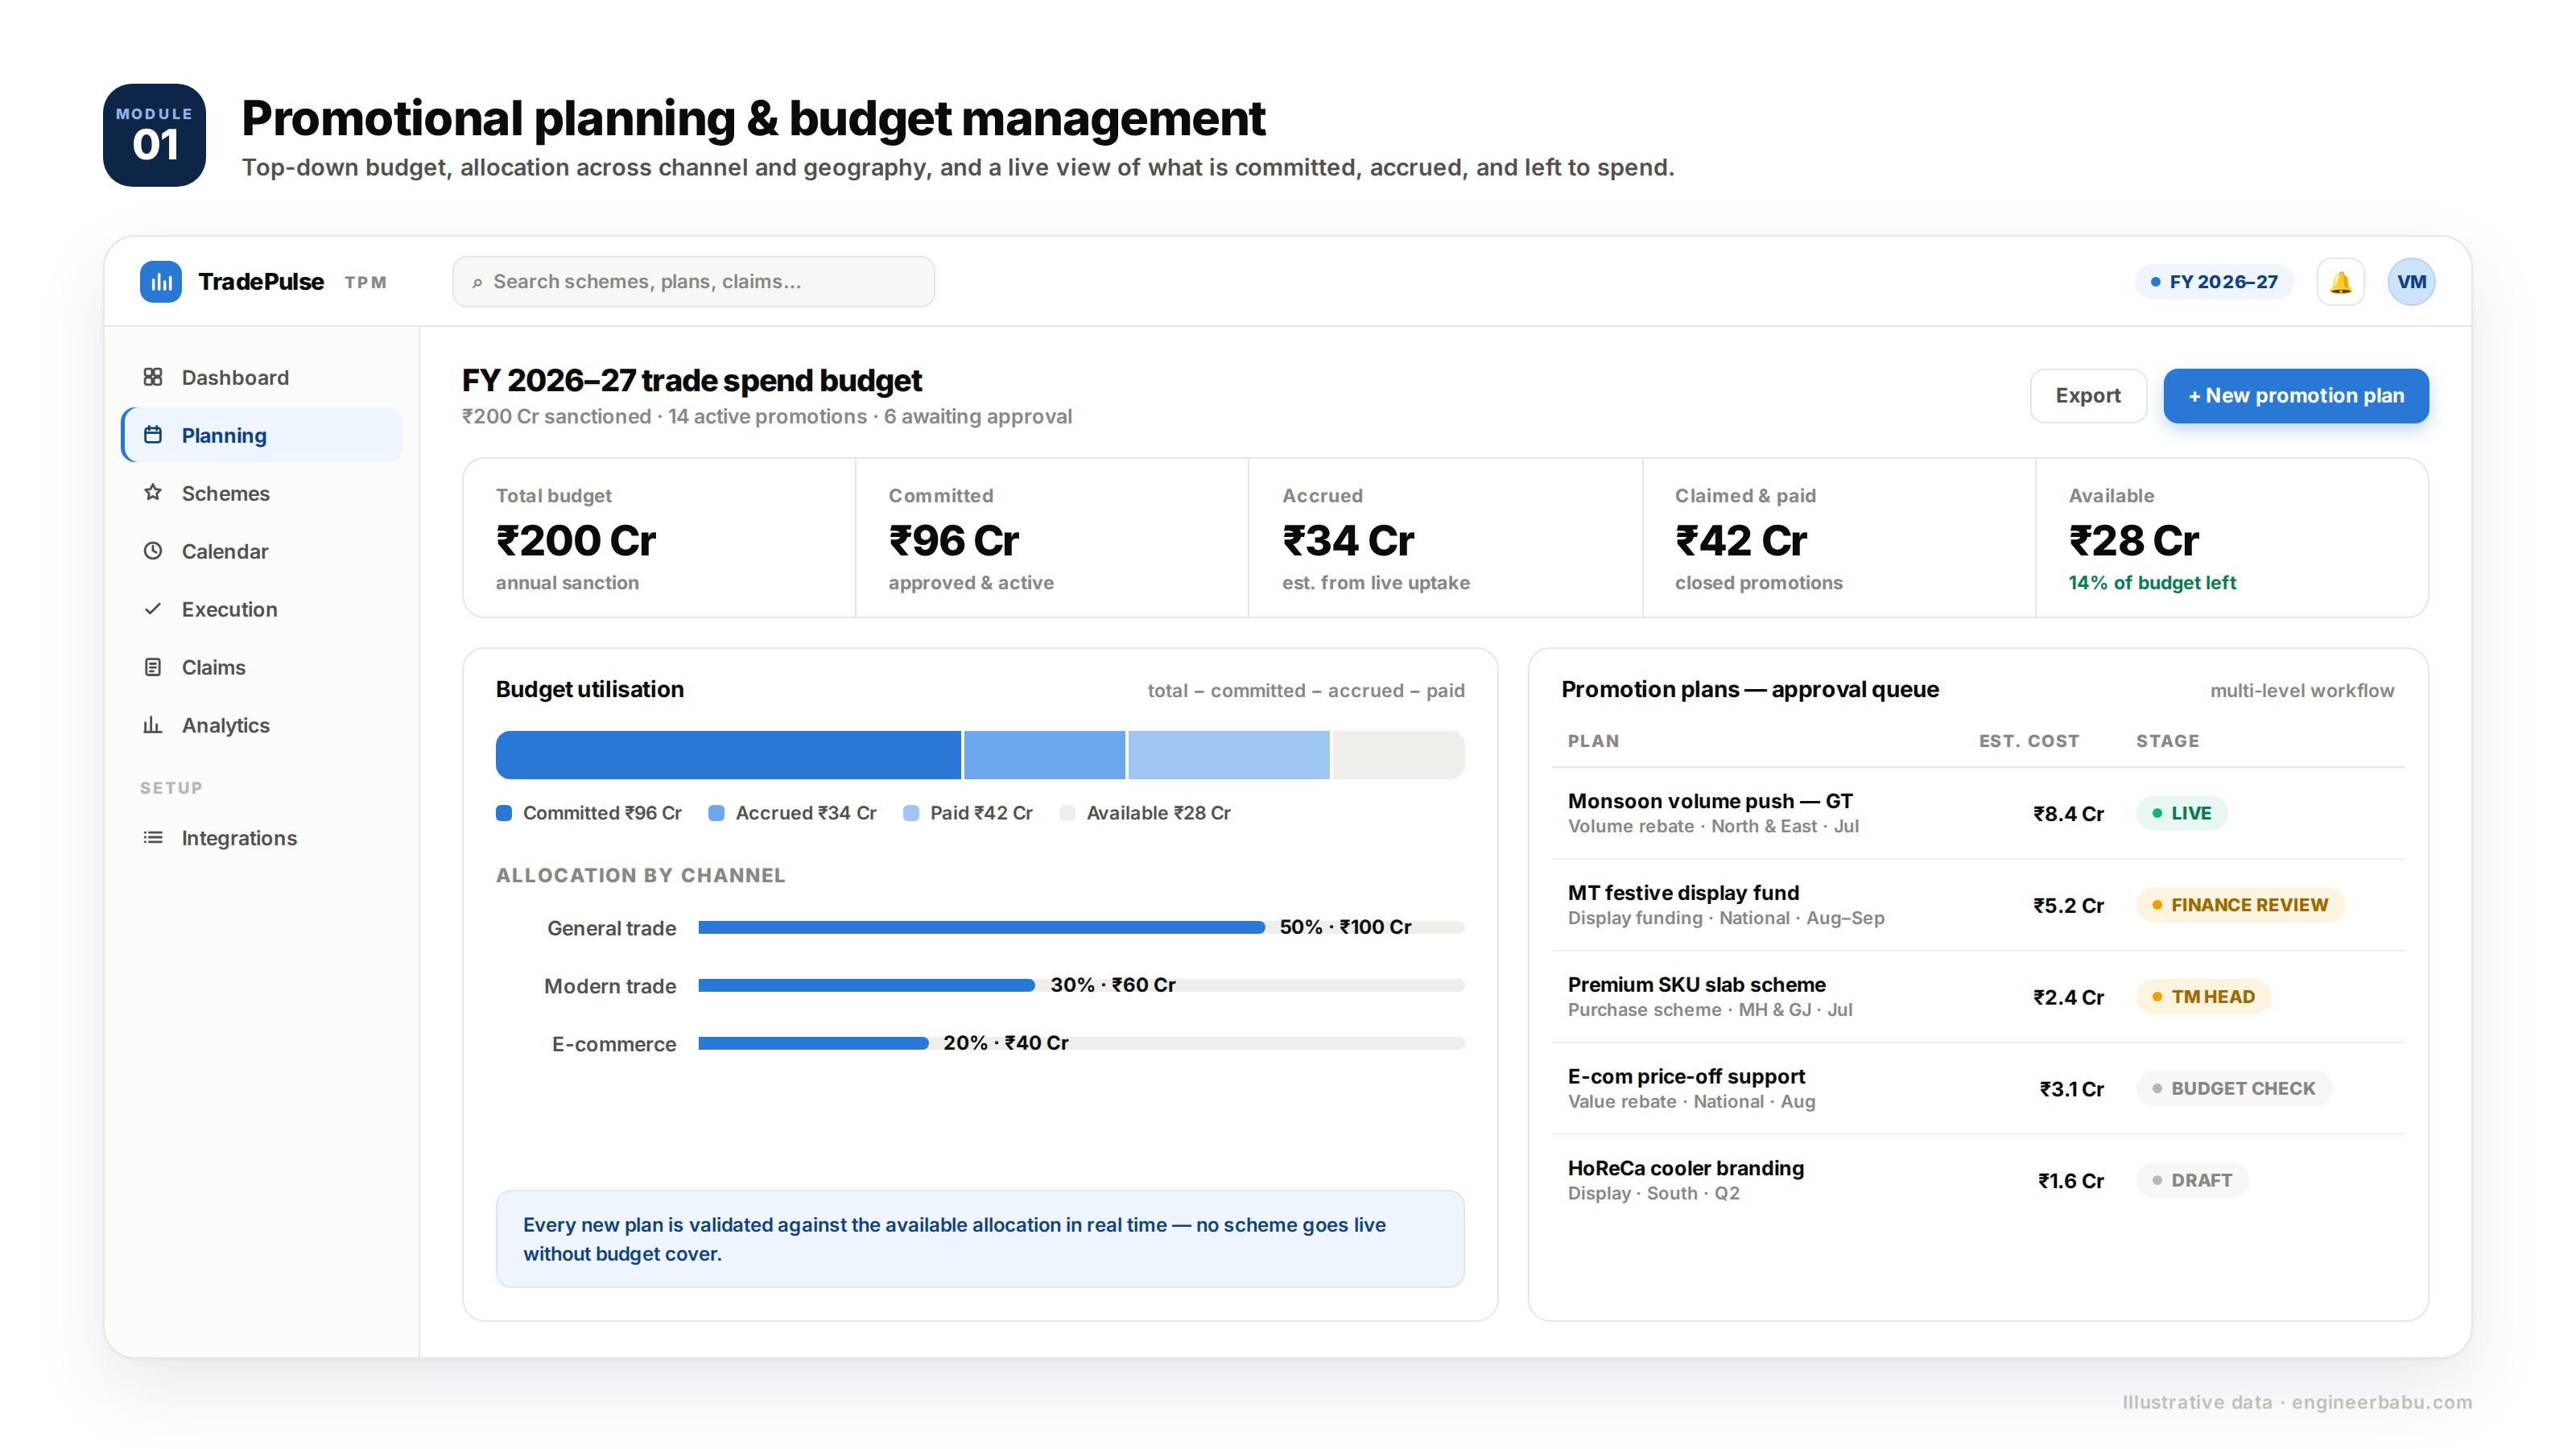
Trade spend planning begins with a top-down budget, the total trade spend the company can afford, typically defined as a percentage of net revenue. This budget is then allocated across:
| Allocation Dimension | Example |
| By channel | Modern trade 30%, general trade 50%, e-commerce 20% |
| By geography | North 25%, South 30%, West 25%, East 20% |
| By brand/category | Brand A 40%, Brand B 35%, Brand C 25% |
| By scheme type | Volume rebates 35%, display funding 20%, in-store promotions 25%, key account discounts 20% |
The promotion plan creation workflow:
| Step | Action | System |
| Plan creation | Marketing or trade marketing creates a promotion plan | Promotion record created |
| Parameter definition | Scheme type, target channel, target geography, eligible SKUs, rates, timeline | Configuration form |
| Budget check | System validates plan cost against available budget allocation | Real-time budget check |
| Approval workflow | Plan reviewed by trade marketing head and finance | Multi-level approval |
| Activation | Approved plan activated, scheme becomes live | Distributors and field team notified |
The budget tracking dashboard:
| View | Details |
| Total budget | Annual trade spend allocation |
| Committed | Budget allocated to approved and active promotions |
| Accrued | Estimated liabilities from active promotions based on current uptake |
| Claimed and paid | Actual payments made against closed promotions |
| Available | Budget − committed − accrued − paid |
The scheme configuration interface:
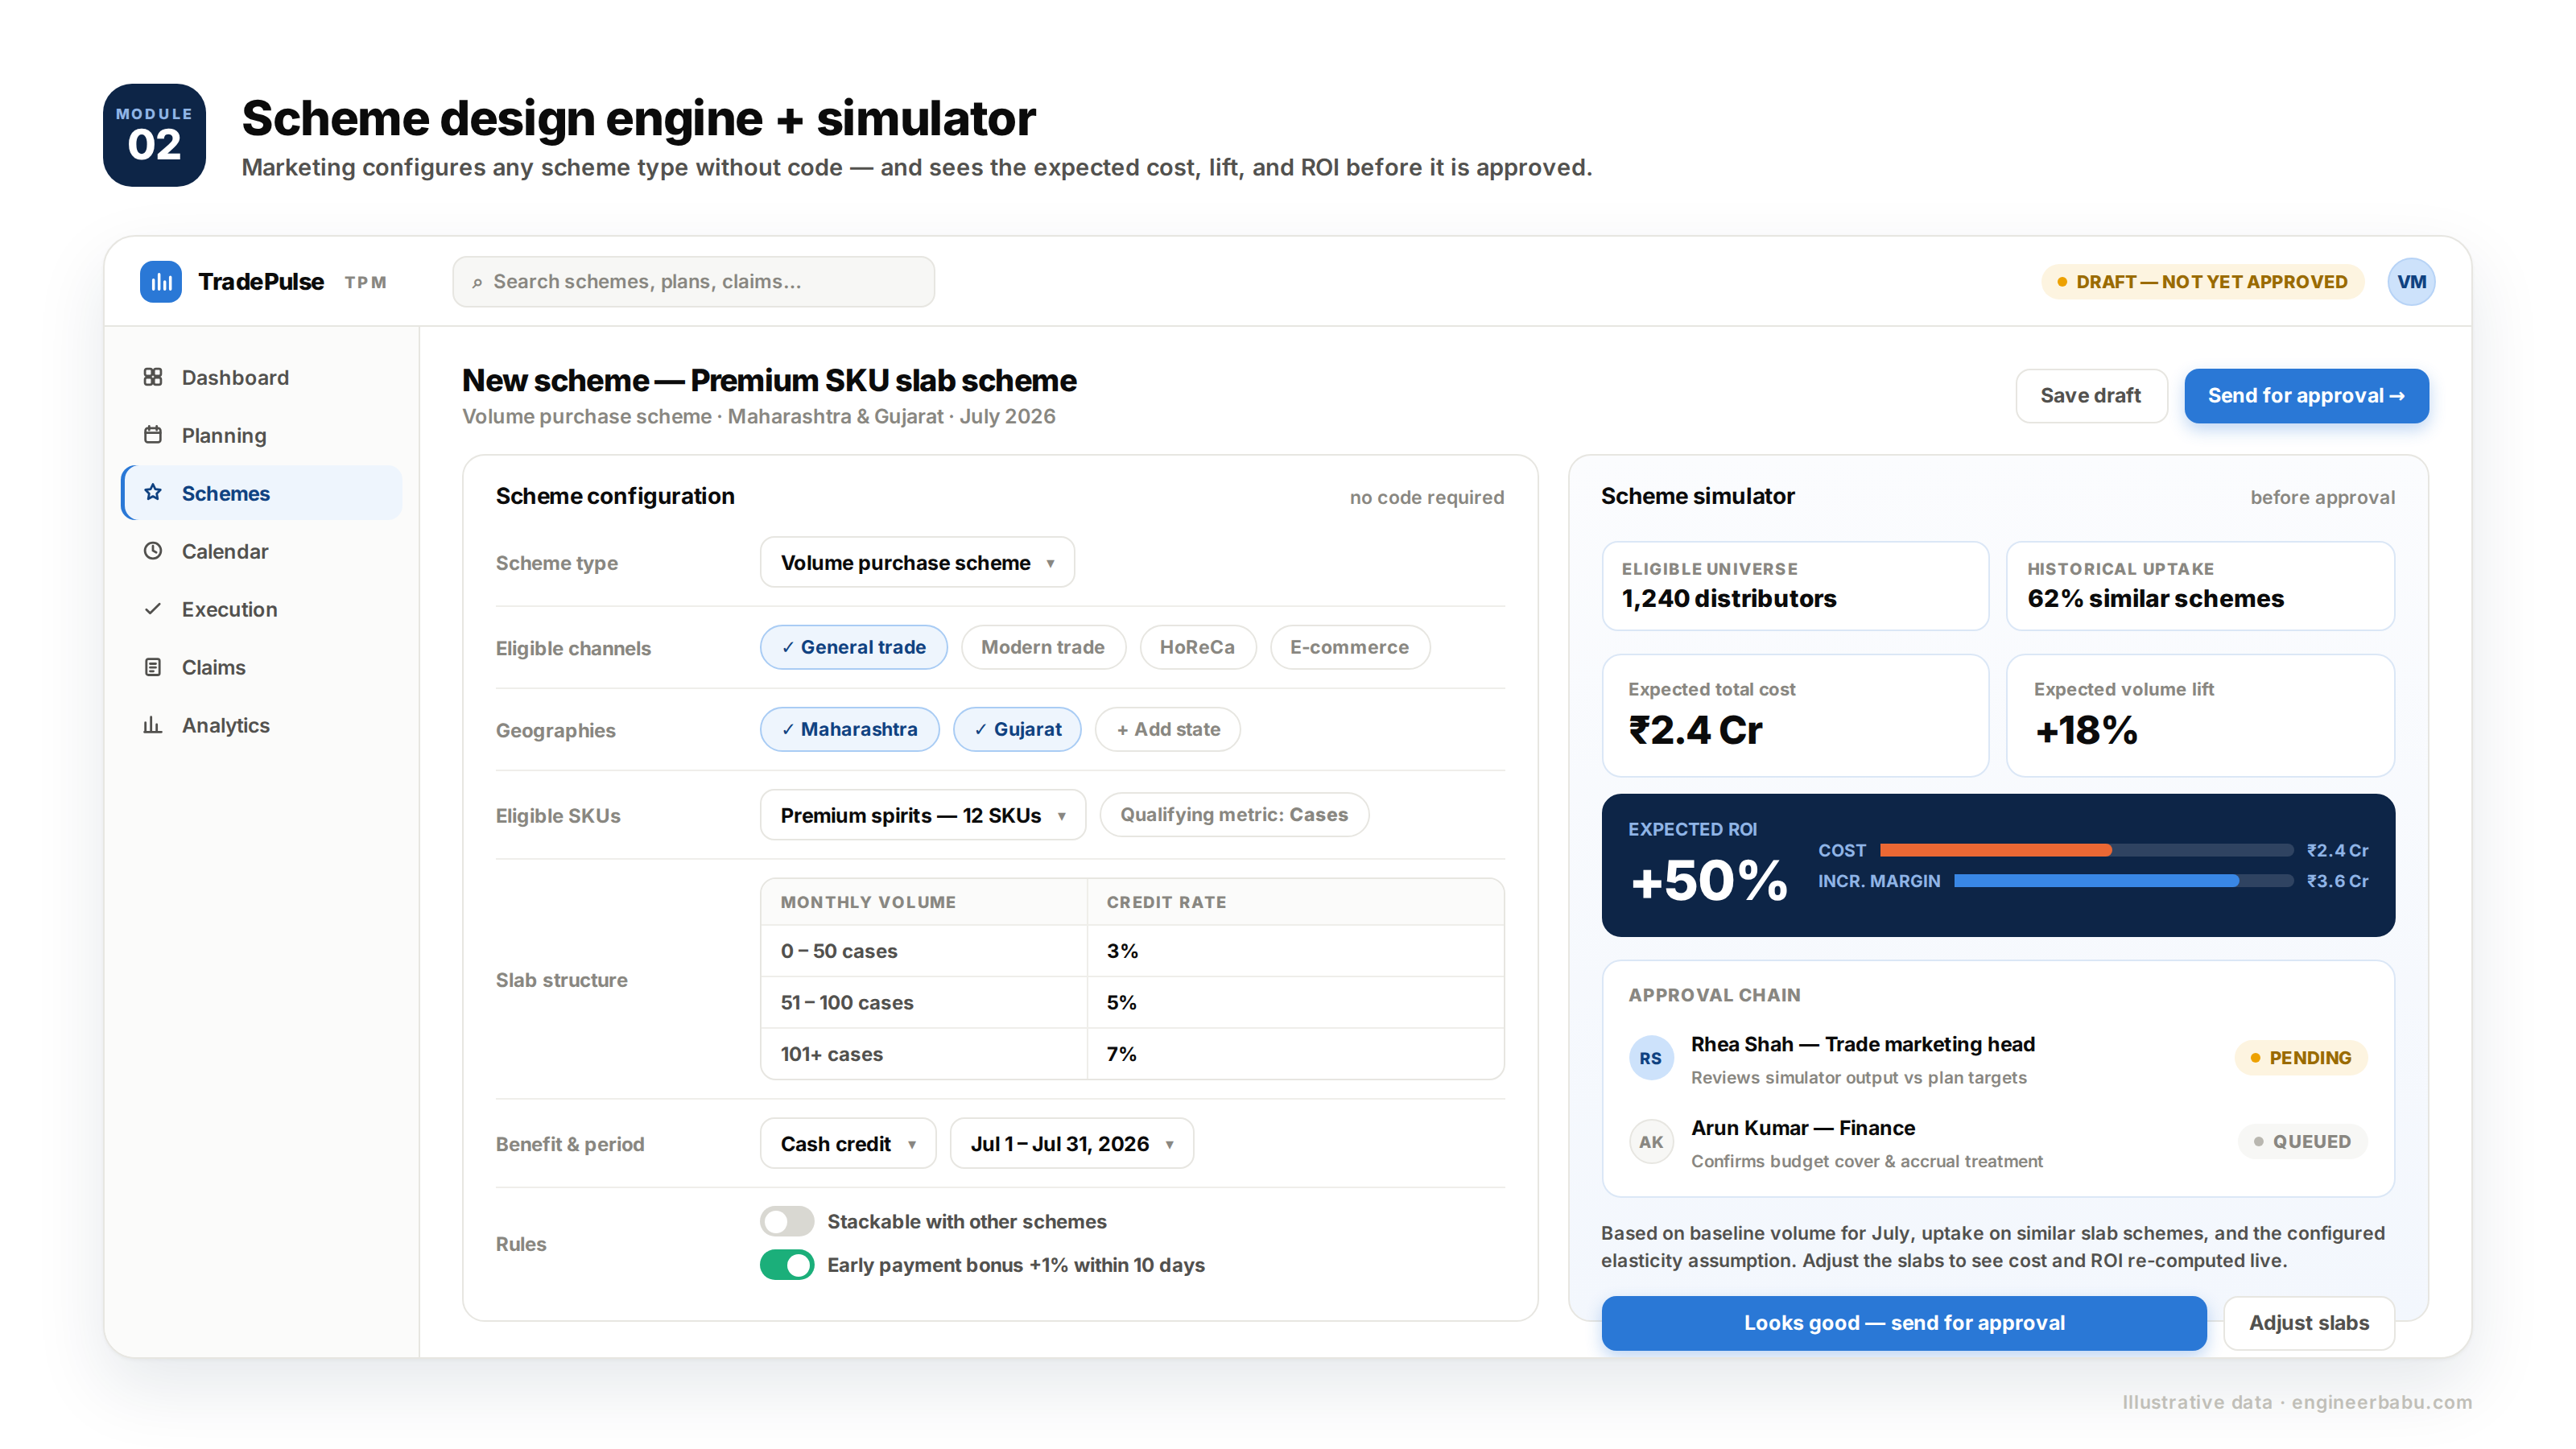
Every promotion scheme has a set of defining parameters. The scheme design engine provides a structured configuration interface, no code required, for marketing teams to define any scheme type.
Scheme parameters:
| Parameter | Options | Example |
| Scheme type | Purchase, secondary, display, in-store, value rebate | Volume purchase scheme |
| Eligible channels | GT, MT, HoReCa, e-commerce | General trade only |
| Eligible geographies | National, regional, state, district | Maharashtra and Gujarat |
| Eligible SKUs | All, category, specific SKUs | Premium spirits SKUs |
| Qualifying metric | Units, cases, value | Cases |
| Slab structure | Flat rate, tiered slabs | 0–50 cases: 3%, 51–100 cases: 5%, 101+ cases: 7% |
| Benefit type | Cash credit, free goods, invoice discount | Cash credit |
| Measurement period | Weekly, monthly, quarterly | Monthly |
| Start and end date | July 1 – July 31, 2026 | |
| Stackability | Is this additive with other active schemes? | No, exclusive |
| Early payment bonus | Additional credit for payment within X days | +1% if paid within 10 days |
The scheme simulator:
Before a scheme is approved, the simulator calculates the expected cost and expected volume lift based on:
Historical volume during the same period, historical uptake rates for similar scheme types, the elasticity assumption (how much incremental volume per percentage point of incentive), and the scheme’s eligible universe (how many distributors/retailers qualify).
The simulator outputs: expected total cost, expected volume lift, expected incremental margin, and expected ROI. The trade marketing head uses this output to decide whether to approve the scheme as designed or adjust the parameters.
The promotional calendar:
The promotional calendar is a visual planning tool, a timeline view showing all active and planned promotions across every channel and geography.
It answers critical questions: Is there a gap period where no scheme is active in a key region? Are two schemes running simultaneously that might conflict or cannibalise each other? Is the second half of the quarter under-invested relative to the first half?
The communication engine:
When a scheme is activated, the communication engine automatically notifies all relevant parties:
| Recipient | Channel | Content |
| Distributors | WhatsApp + DMS portal notification | Scheme details, eligible SKUs, rates, slabs, period |
| Field sales team | Field force app notification | Scheme brief, what to communicate to retailers |
| Sales managers | Scheme overview, targets, tracking approach | |
| Key accounts | Email + account manager notification | Key account-specific scheme details |
The scheme communication is not a generic announcement. It is customised per recipient, a distributor in Gujarat receives only the schemes applicable to their territory and channel. A distributor in Rajasthan does not see Gujarat-specific schemes.
A promotion that exists on paper but is not executed in the market is not a promotion, it is a cost. The execution tracking module confirms that what was planned is happening on the ground.
Execution tracking for display and POSM schemes:
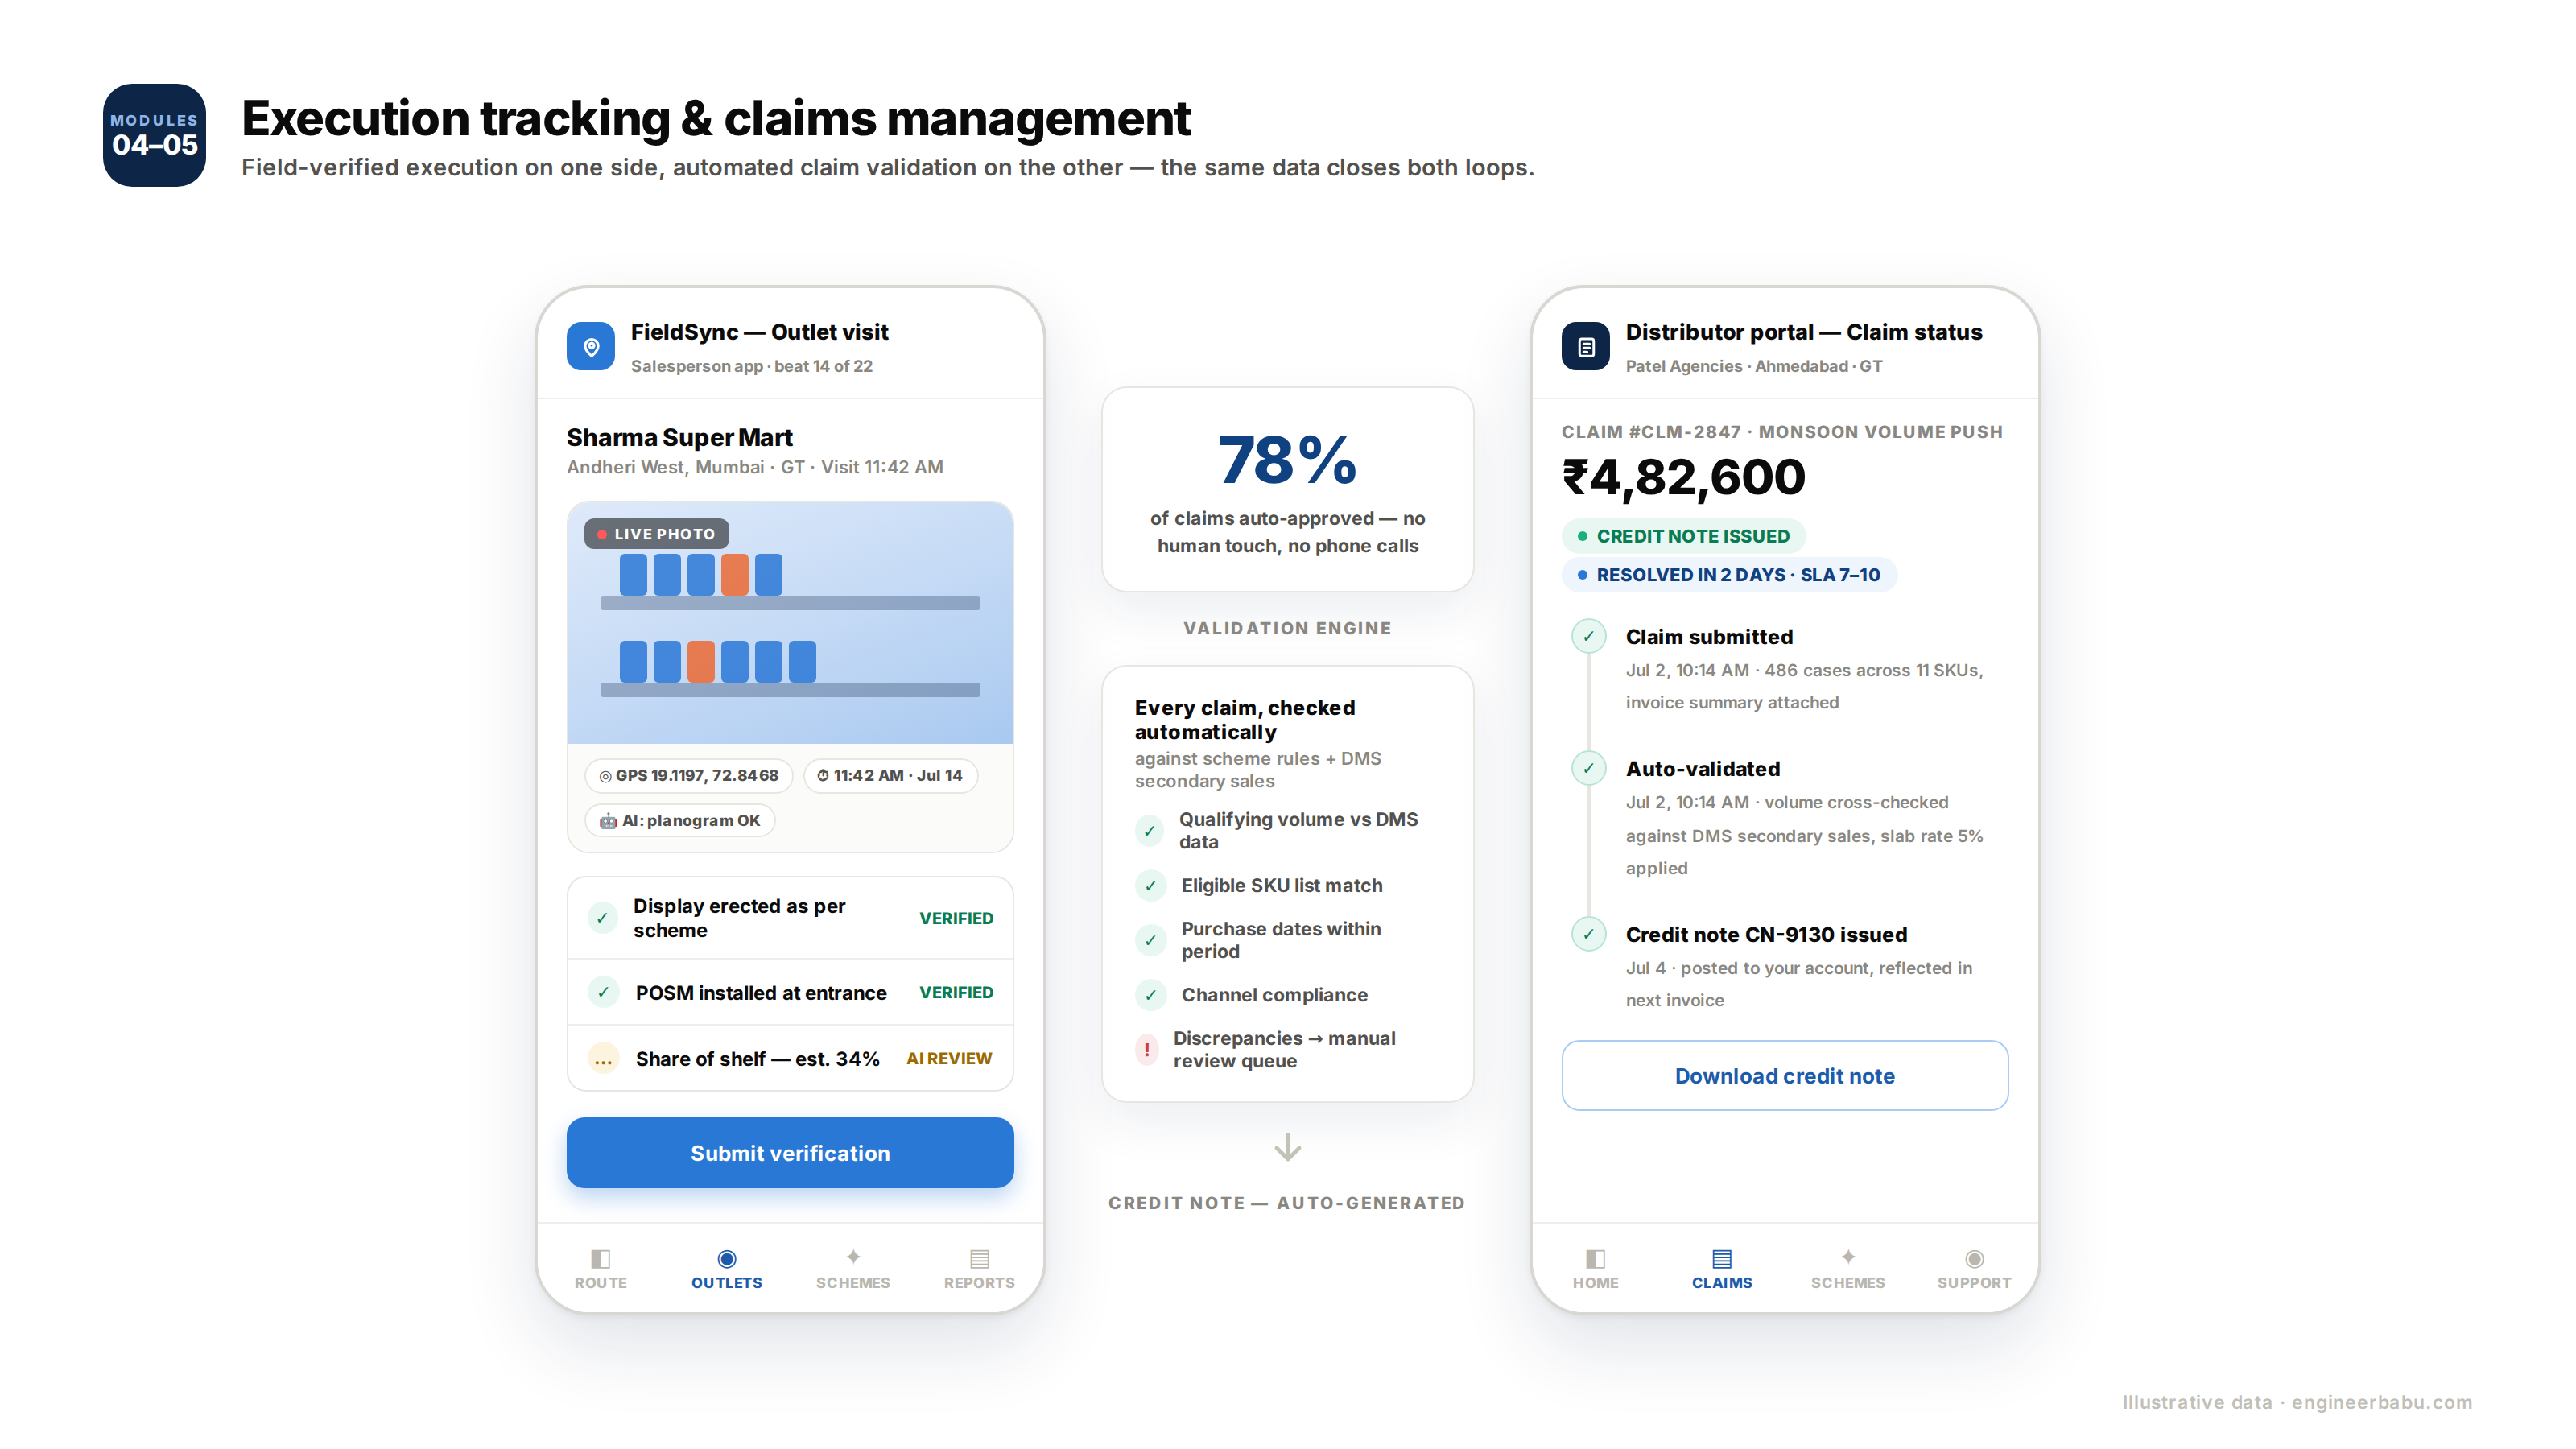
For schemes that require physical execution, a display erected at an outlet, POSM material installed, a shelf display set up, the field force app collects live photo evidence during the salesperson’s outlet visit.
| Execution Element | Verification Method | System Action |
| Display erected | Live camera photo, GPS-tagged, timestamped | Photo stored against outlet record, scheme claim enabled |
| POSM installed | Live photo showing POSM at location | Photo reviewed by area manager, approved or rejected |
| Cooler branded | Live photo showing branding | Same as above |
| Share of shelf achieved | Estimated percentage from live photo | AI image analysis or manual estimation |
| Competitor price noted | Structured field entry | Competitive intelligence data |
AI-powered image validation (Phase 2):
The system can be enhanced with AI image analysis, using computer vision to automatically verify that the photo shows the correct display, the correct POSM material, and that it was installed correctly as per the planogram.
This reduces the manual review burden for area managers from reviewing every photo to reviewing only photos that the AI flags as potentially non-compliant.
The claims submission workflow:
When a scheme period ends, distributors submit their claims through the DMS portal or the TPM platform’s distributor interface. Each claim includes:
| Claim Component | Validation Method |
| Qualifying volume | Cross-referenced against secondary sales data in DMS |
| Eligible SKUs | Matched against scheme’s eligible SKU list |
| Period compliance | Purchase or sales dates within scheme period |
| Supporting documents | Invoice copies or system-generated sales summary |
| Channel compliance | Distributor’s channel matches scheme’s eligible channel |
Automated claim validation:
The validation engine runs every claim against the scheme rules and the secondary sales data automatically. Claims that pass all validation checks are auto-approved.
Claims with discrepancies, the distributor claims volume that does not appear in secondary sales data, are flagged for manual review with the specific discrepancy highlighted.
The claim validation result:
| Result | Action |
| Validated, full amount | Credit note generated automatically |
| Validated, partial amount | System calculates eligible amount, generates partial credit note |
| Requires manual review | Routed to trade marketing team with discrepancy detail |
| Rejected | Rejection reason communicated to distributor via portal |
Claim aging and SLA management:
All open claims appear in a queue with the date submitted and days elapsed. Claims exceeding the company’s stated resolution SLA, typically 7 to 10 business days, are escalated automatically to the claims manager.
The distributor can see their claim status in real time through the portal, no need to call the company to find out where their claim is.
The ROI calculation framework:
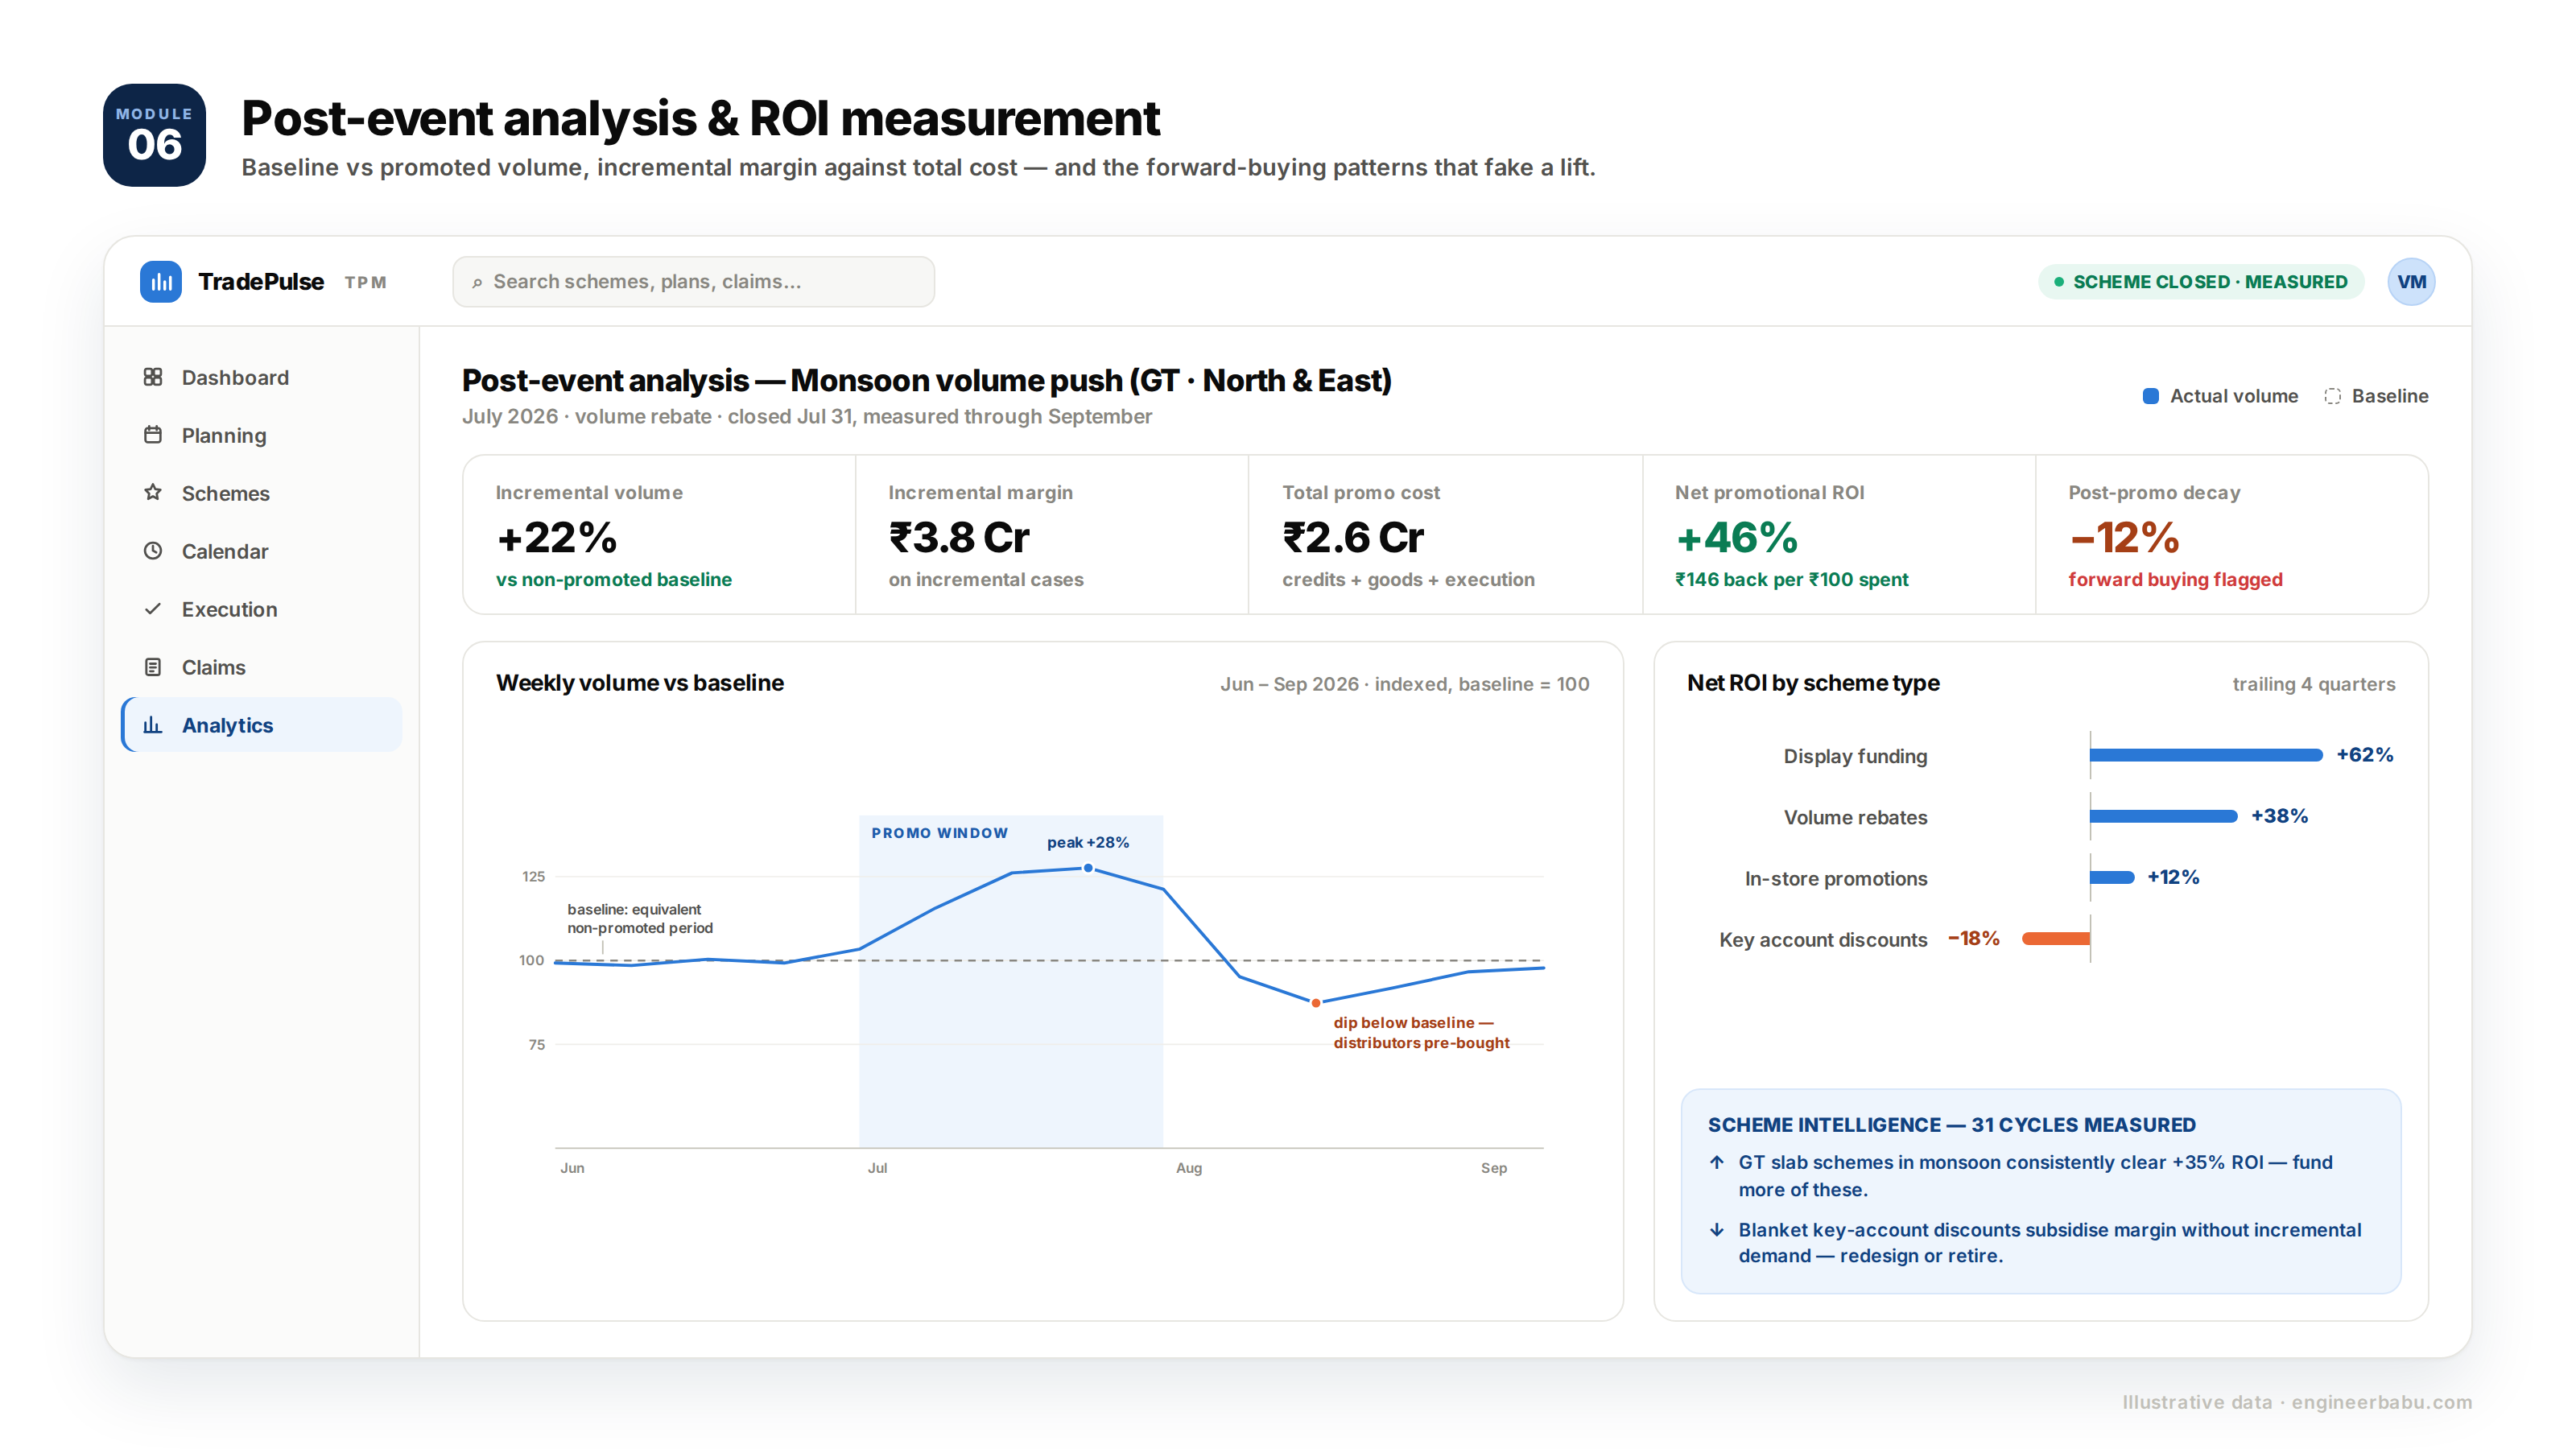
| Metric | Calculation |
| Total promotional cost | Scheme credits paid + free goods cost + field execution cost |
| Baseline volume | Volume during an equivalent non-promoted period |
| Promotional volume | Actual volume during the scheme period |
| Incremental volume | Promotional volume − baseline volume |
| Incremental revenue | Incremental volume × net realisation per case |
| Incremental gross margin | Incremental revenue − cost of goods for incremental volume |
| Net promotional ROI | (Incremental gross margin − total promotional cost) / total promotional cost × 100 |
What good promotional ROI looks like:
A scheme generating a positive ROI means the incremental margin from the volume lift exceeds the promotional cost. A scheme generating a negative ROI is subsidising distributor and retailer margin without driving incremental consumer demand.
Over time, identifying which scheme types consistently generate positive ROI and which consistently generate negative ROI is the most valuable output of a TPM platform.
The post-event analysis report:
| Dimension | Metrics |
| Volume | Baseline, promotional, incremental, lift % |
| Revenue | Total revenue during period, incremental revenue |
| Cost | Total promotional cost, cost per incremental case |
| ROI | Net promotional ROI % |
| Market share | Share before, during, after promotion |
| Halo effect | Did adjacent SKUs also lift? |
| Carry-forward effect | Did volume sustain after promotion ended or return to baseline? |
The scheme intelligence database:
Over multiple promotional cycles, the platform builds a historical database of scheme ROI by: scheme type, channel, geography, time of year, SKU, and competitive context.
This database becomes the foundation for more accurate promotional planning, schemes designed based on evidence of what has worked, not what someone thinks might work.
| Module | Cost Range (USD) | Notes |
| Promotional planning + budget management | $8K – $15K | Budget allocation, plan creation, approval |
| Scheme design engine + simulator | $10K – $18K | All scheme types, no-code configuration |
| Promotional calendar | $4K – $8K | Visual planning tool |
| Communication engine (WhatsApp + portal) | $5K – $10K | Automated, targeted notification |
| Execution tracking + field photo verification | $6K – $12K | GPS-tagged photo, AI validation (Phase 2) |
| Claims management + automated validation | $10K – $18K | DMS integration for secondary sales cross-check |
| Post-event analysis + ROI calculation | $8K – $15K | |
| Trade spend analytics dashboard | $6K – $12K | ROI by dimension, scheme intelligence DB |
| Forecast and simulation engine | $8K – $15K | ML-powered lift prediction |
| DMS + field force app integration | $6K – $12K | Bidirectional data sync |
| AWS + VAPT + Year 1 ops | $5K – $10K | |
| Total | $76K – $145K | Full TPM platform |
EngineerBabu built supply chain and distribution intelligence for Simba Beer and enterprise operations for Adani Group. CMMI Level 5. Google AI Accelerator 2024 Top 20. Contact: mayank@engineerbabu.com
Trade promotions are incentives offered to channel partners, distributors, retailers, wholesalers, and key accounts, to influence their purchasing, stocking, and selling behaviour. Examples include volume rebates paid to distributors who achieve a quarterly purchase target, shelf placement fees paid to modern trade chains, and display funding given to retailers who set up branded displays. Consumer promotions are incentives offered directly to end consumers, buy one get one free offers, price reductions on the pack, loyalty points. Trade promotions management (TPM) specifically manages the planning, execution, and evaluation of the channel incentive layer. In FMCG companies, trade spend often represents 15 to 25% of gross revenue, making it one of the largest and least analytically managed line items in the P&L.
A TPM platform calculates promotional ROI by comparing incremental volume and margin against the total promotional cost. The incremental volume is the difference between actual sales during the promotional period and the baseline, the volume that would have been sold without the promotion, estimated from historical data for equivalent non-promoted periods. The incremental margin is the gross profit contribution from that incremental volume. The total promotional cost includes the scheme credits paid, the value of free goods issued, and the field execution costs. ROI is then (incremental gross margin − total promotional cost) / total promotional cost × 100. A promotional ROI of 50% means that for every ₹100 spent on the promotion, ₹150 in incremental gross margin was generated, a positive return. A negative ROI means the promotion transferred margin to the channel without generating sufficient incremental demand to justify the cost.
The primary reason is the absence of closed-loop measurement. Most companies plan promotions, execute them, pay the claims, and move on to the next quarter without systematically measuring what the promotion actually generated in incremental volume and margin. Without this measurement, there is no feedback loop, the same scheme types that generated poor ROI get re-run because nobody proved they did not work. The second reason is forward buying, a scheme that drives 20% volume lift in month one followed by a 15% decline in month two because distributors pre-bought rather than generated incremental consumer demand. A TPM platform that tracks post-promotion volume decay identifies forward buying patterns and separates schemes that drive real demand from schemes that simply shift timing. The third reason is poor targeting, schemes offered to the entire distributor base when only a subset would have bought incrementally, resulting in scheme cost being paid on volume that would have happened anyway.