How to Build a Field Force Automation Platform, Beat Planning, PJP, Order Booking, GPS Tracking, and Merchandising 2026


Create engaging, high-performance mobile applications tailored to your business needs. We craft future-ready apps that offer smooth user experiences on all devices.
Build robust and scalable websites and CMS platforms that help you manage content effortlessly. Our development ensures a seamless digital presence.
Launch secure, feature-rich online stores with intuitive shopping experiences. We build tailored eCommerce platforms designed for growth.
Design captivating games with immersive gameplay and stunning graphics. From concept to launch, we build engaging experiences that players love.
Enhance your customer relationships with customized Salesforce implementations. Drive growth and efficiency with smarter CRM solutions.
Harness artificial intelligence and machine learning to automate workflows and gain actionable insights. Our AI transforms data into smart decisions.
Accelerate your software delivery lifecycle with continuous integration, delivery, and infrastructure automation to boost efficiency.
Hire app developers ready to turn your ideas into sleek, high-performing mobile apps for any platform.
Bring in frontend pros who craft smooth, beautiful, and user-friendly interfaces that your visitors will love.
Get backend developers who build fast, secure, and reliable systems to keep everything running behind the scenes.
Hire eCommerce developers who build secure, scalable online stores designed to offer seamless shopping and grow your sales.
Get dedicated developers committed to your projects, delivering consistent quality and speed as an extension of your team.
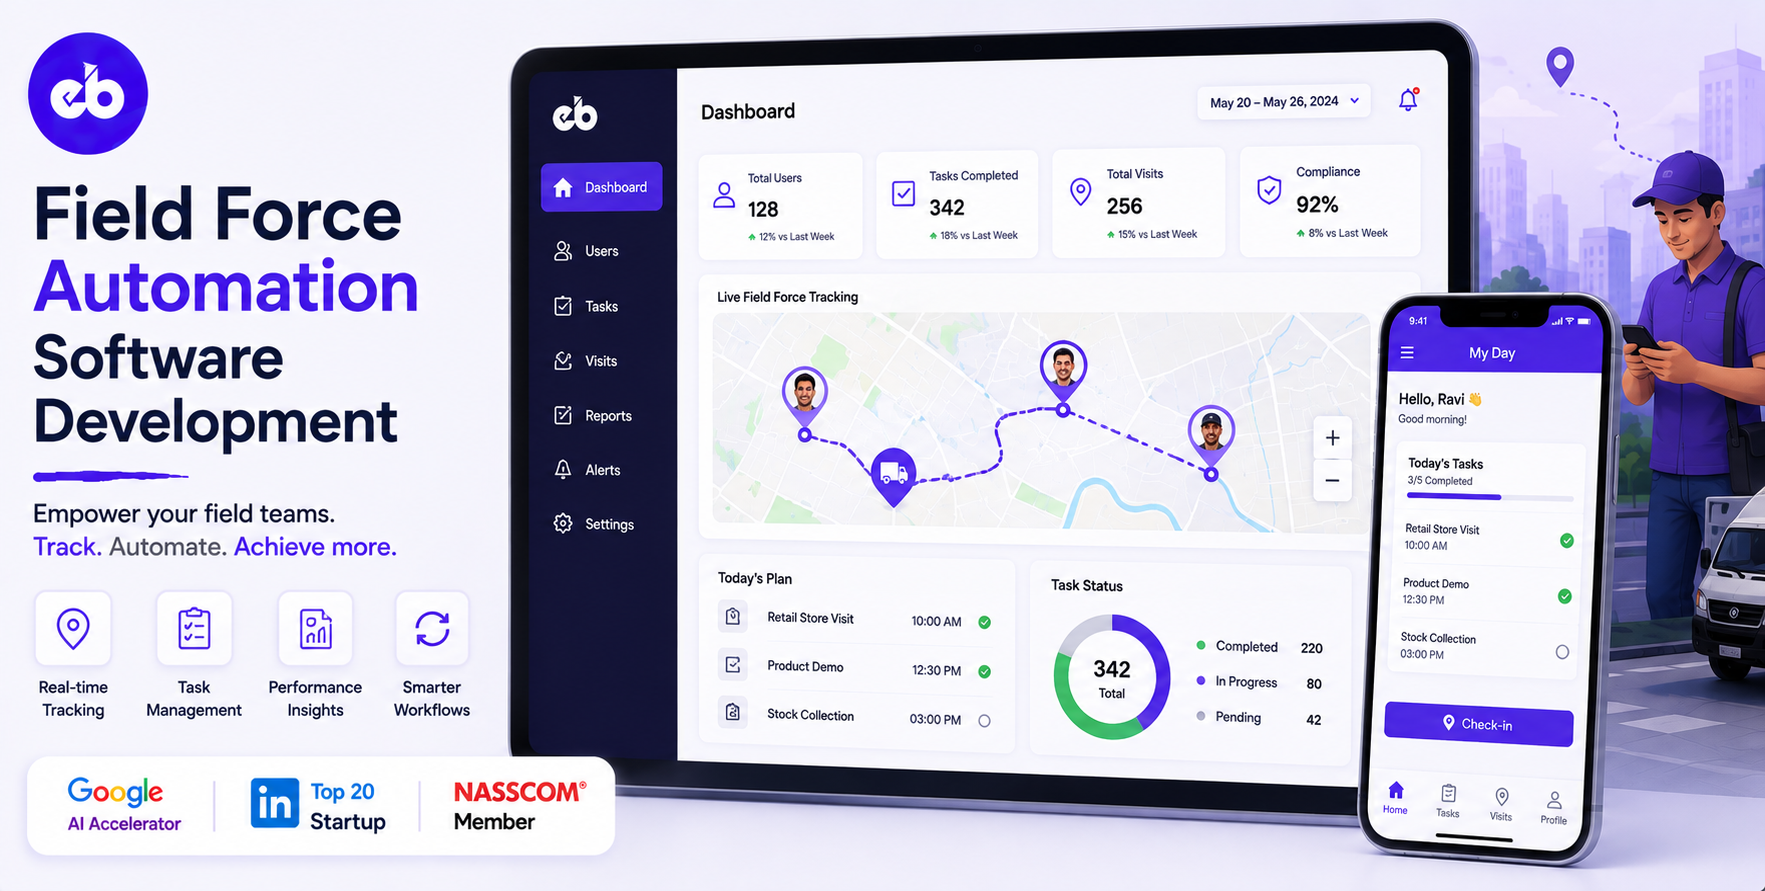
An FMCG company with 500 field sales representatives who each visit 25 outlets per day generates 12,500 retail touchpoints daily. Without a field force automation platform, the information from those 12,500 visits lives in WhatsApp messages, handwritten notebooks, and the salesperson’s memory.
The sales manager knows what last month’s sales were. They have no idea what is happening in the market today.
A field force automation platform turns every field visit into structured data, who visited which outlet, what order was placed, what the shelf looked like, what the competitor was doing, what the retailer said, and makes that data available to the entire organisation in real time.
For FMCG companies, this is the difference between managing the field and letting the field manage itself.
EngineerBabu built field operations intelligence for Simba Beer and enterprise operations for Adani Group. CMMI Level 5. Google AI Accelerator 2024 Top 20. Contact: mayank@engineerbabu.com
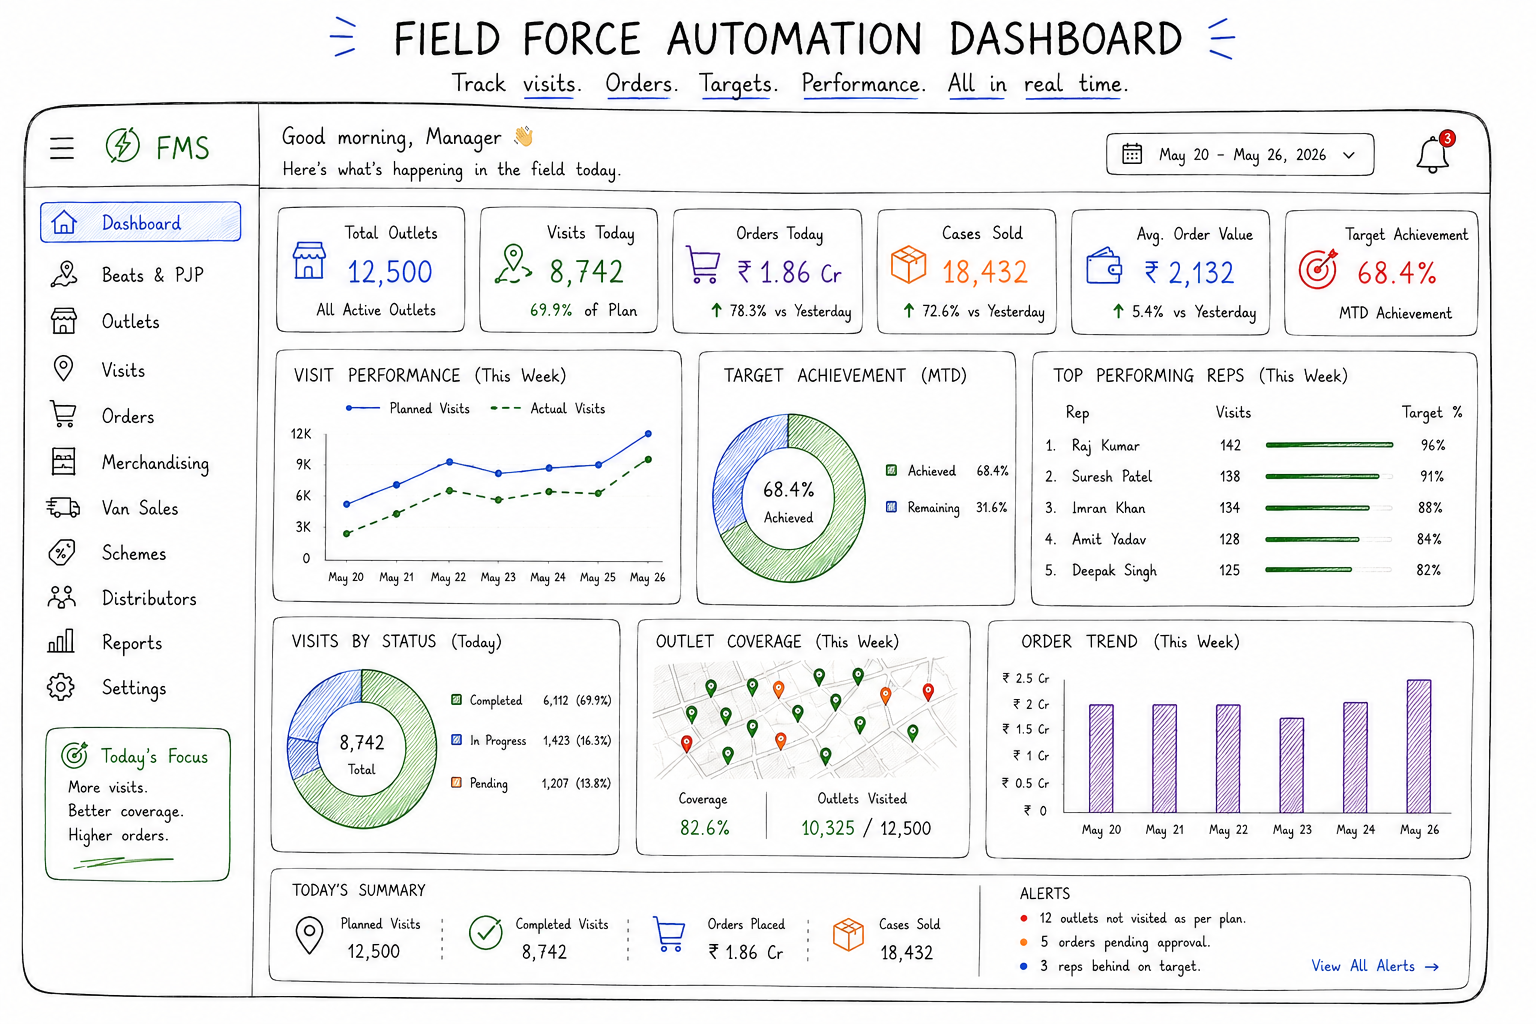
| Function | Module |
| Beat planning | Optimal visit routing per salesperson per day |
| PJP (Permanent Journey Plan) | Weekly/monthly recurring visit schedules |
| Outlet management | Complete outlet profile, segment, contact |
| Order booking | On-the-spot order capture with product catalogue |
| Attendance and location tracking | GPS-based check-in and out |
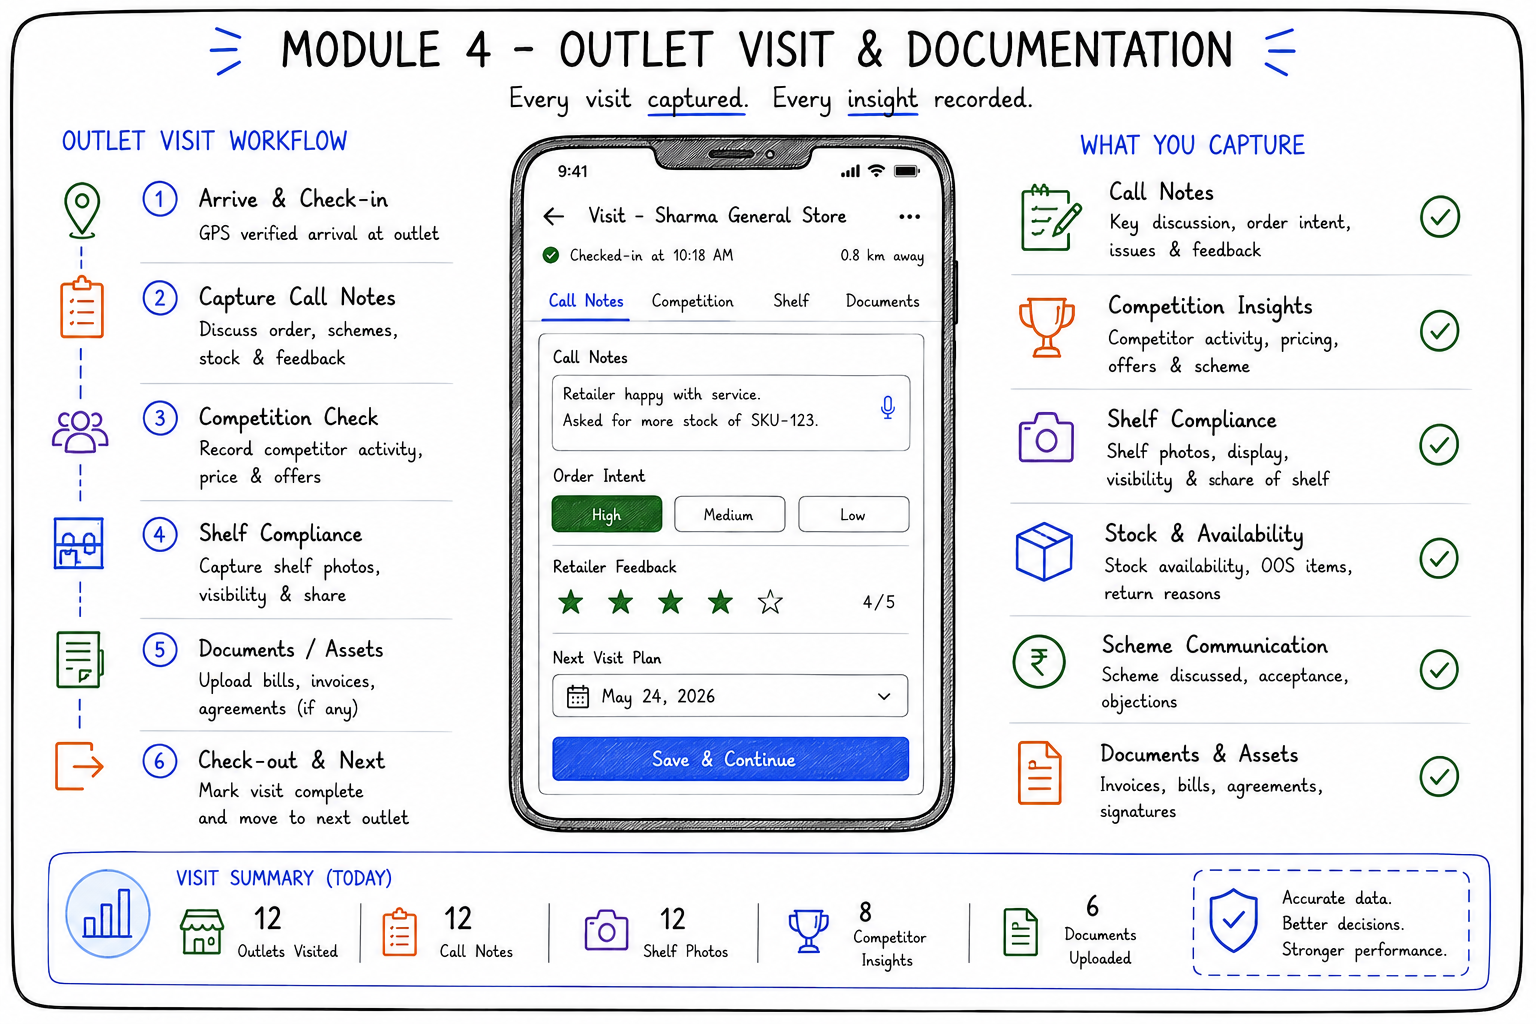
| Outlet visit documentation | Call notes, competition data, shelf compliance |
| Van sales / pre-sales | Stock in van tracking, load and unload |
| Merchandising compliance | Shelf photo, planogram check, display verification |
| Target vs achievement | Daily and monthly KPI tracking per rep |
| Scheme and promotion communication | Active scheme details available to field team |
| Distributor management | Distributor stock and order visibility |
| Analytics and reporting | Visit productivity, order conversion, coverage |
What is a beat?
A beat is the defined set of outlets that a salesperson visits in a day. A well-designed beat groups outlets that are geographically proximate, that can be visited in a single shift, and that are classified by visit frequency, some outlets need daily visits, others weekly, others fortnightly.
Beat planning inputs:
| Input | Details |
| Outlet universe | Every outlet the company services, with GPS coordinates |
| Visit frequency | How often each outlet category needs a visit |
| Salesperson home base | Where the salesperson starts and ends their day |
| Working hours | Hours available per day |
| Historical call rate | How many outlets a salesperson typically covers per day |
The beat optimisation engine:
Given these inputs, the beat planning engine groups outlets into daily beats that minimise total travel time while ensuring every outlet is visited at its required frequency.
The output is a PJP (Permanent Journey Plan), a weekly or monthly schedule showing which salesperson visits which outlets on which day.
The optimisation approach:
Beats are a variant of the Vehicle Routing Problem with Time Windows, each outlet has a required visit frequency (time window constraint) and a location (routing constraint).
The platform uses OR-Tools or a custom VRP solver to generate beats that minimise travel time while satisfying all visit frequency requirements.
Dynamic beat adjustment:
When a new outlet is added to the company’s distribution network, the beat planning engine re-optimises the affected territory to incorporate the new outlet into the closest beat without significantly increasing any salesperson’s travel burden.
When a salesperson leaves, their beat is temporarily redistributed across the team until a replacement is hired and trained.
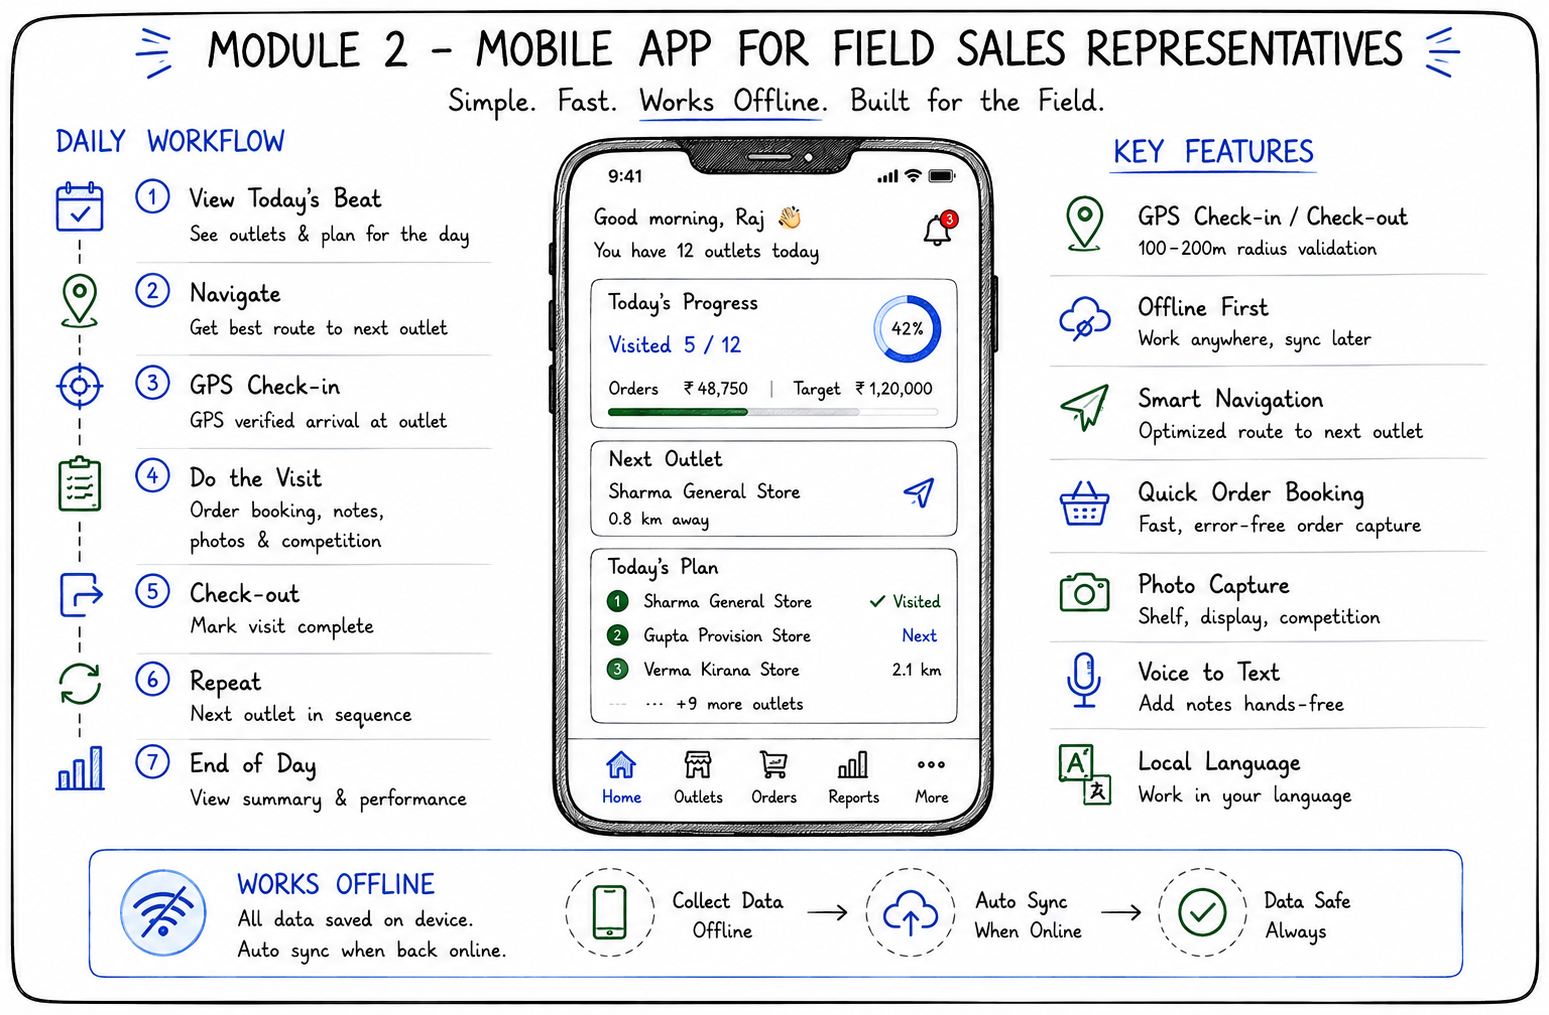
The mobile app is the primary interface for field salespeople. It must work in areas with poor connectivity, load fast, and require minimal data entry, a salesperson who spends 20 minutes per outlet on data entry cannot achieve the call rate the business needs.
The daily workflow in the app:
| Time | Action | App Screen |
| Morning | View today’s beat | Today’s outlets list with sequence and map |
| Travel to first outlet | Navigation | Map with route to first outlet |
| Arrive at outlet | Check-in | GPS-confirmed arrival, outlet card opens |
| Conduct the visit | Order booking, competition notes, shelf check | Order screen, visit form |
| Depart the outlet | Check-out | GPS-confirmed departure, next outlet cued |
| Repeat for all outlets | — | — |
| End of day | Summary view | Outlets visited, orders placed, targets achieved |
GPS-based attendance and visit verification:
The app records GPS coordinates at check-in and check-out for every outlet visit. The platform validates that check-in GPS coordinates match the outlet’s registered location within a defined radius, typically 100 to 200 metres. Check-ins from outside this radius are flagged as ghost visits requiring explanation.
Offline capability:
Retail markets in India include areas with poor or no cellular connectivity, industrial estates, rural areas, basements.
The field app must function offline, allowing the salesperson to conduct their full workflow, book orders, take photos, and complete call reports without connectivity. All data is cached locally and synchronised to the server when connectivity is restored.
The product catalogue on device:
The salesperson’s device has the full product catalogue, products, SKUs, pack sizes, prices, schemes active for this outlet, cached locally so order booking works offline.
The order booking flow:
Van sales / pre-sales mode:
For van sales operations, where the salesperson carries stock in their van and sells directly, the app supports two modes:
Pre-sales mode: Order is booked during the visit, fulfilled from the distributor later. Van sales mode: Order is fulfilled from stock in the van immediately. Van inventory decrements in real time as each sale is made.
Van load and unload are recorded, opening stock confirmed at day start, closing stock counted at day end. Any variance between calculated closing stock and actual count triggers an investigation.
The structured call report:
Every outlet visit generates a structured call report, not a free-text note, but a form that captures specific data points that feed into analytics.
| Field | Input Type | Analytics Use |
| Outlet availability check | Checklist, which of our SKUs are currently stocked | Coverage rate per SKU |
| Competitor stock check | Which competitor brands are stocked | Competitive intelligence |
| Shelf share estimate | Our products vs total shelf space % | Share of shelf tracking |
| Display compliance | Is our display/POSM correctly placed? | Execution compliance |
| Retailer feedback | Structured categories, pricing issue, quality complaint, competitor offer | Retailer intelligence aggregation |
| Reason for no order | If no order placed, why | Non-ordering reason analysis |
Merchandising photo compliance:
For key accounts and high-visibility outlets, the platform requires a photo of the shelf or display, captured live from the camera, GPS-tagged, timestamped. The photo is uploaded to the outlet’s record and available for review by the area manager.
Phase 2 can add AI-powered image analysis, automatically detecting whether the planogram is correct, whether our products occupy the correct shelf position, and whether competitor products have expanded their shelf space.
Hierarchy of targets:
| Level | Target Type | Example |
| National | Monthly sales volume by category | 10,000 cases of premium spirits |
| Regional | Regional allocation of national target | South region: 3,200 cases |
| Area | Area manager allocation | Bangalore area: 800 cases |
| Territory | Salesperson allocation | SR-045: 120 cases |
| Outlet | Outlet-level target | Outlet X: 12 cases |
The live scorecard per salesperson:
| Metric | Target | Achievement | % |
| Outlets visited today | 25 | 22 | 88% |
| Orders placed | 18 | 15 | 83% |
| Order value | ₹45,000 | ₹38,400 | 85% |
| SKU productivity (SKUs per order) | 3.5 | 3.1 | 89% |
| Monthly volume target | 120 cases | 84 cases (22 days) | 70% |
Manager visibility:
The area manager sees every salesperson’s real-time scorecard, who is behind target, who is not achieving their visit plan, who is consistently under-ordering.
Alerts fire when a salesperson falls more than 15% behind their daily visit plan by midday, the manager can call and course-correct in time to recover the day.
The field force app is most powerful when the salesperson can see distributor stock levels during the outlet visit.
A salesperson who books an order for 10 cases of SKU-X when the distributor has only 3 in stock is creating a fulfillment problem that reflects on the field team even though it is a supply problem.
Distributor stock visibility in the app:
The app shows, for the outlets in the salesperson’s beat, which SKUs are available at their serving distributor.
When booking an order, if a requested quantity exceeds available distributor stock, the android or iOS app warns the salesperson immediately, they can book the available quantity and flag the shortage, or reduce the order to match availability.
Secondary sales reporting:
The platform pulls secondary sales data, what distributors sold to retailers, from the distributor DMS or from the structured data feed described in the liquor distribution platform blog.
This secondary sales data is overlaid with field-reported orders to identify discrepancies, orders the field team reported that do not appear in distributor sell-out data, which signals potential order fabrication.
| Module | Cost Range (USD) | Notes |
| Beat planning + PJP optimisation engine | $8K – $15K | OR-Tools VRP solver |
| Mobile app (Flutter, iOS + Android, offline) | $12K – $22K | Offline-first architecture critical |
| GPS attendance + visit verification | $5K – $10K | Geofencing, ghost visit detection |
| Order booking engine + catalogue | $8K – $15K | Offline catalogue, scheme calculation |
| Van sales / pre-sales mode | $5K – $10K | Van inventory, load/unload |
| Structured call report + competition tracking | $5K – $10K | |
| Merchandising photo compliance | $4K – $8K | GPS-tagged, timestamped live capture |
| Target setting + live scorecard | $5K – $10K | Hierarchy cascade |
| Distributor stock integration | $5K – $10K | Real-time stock visibility in app |
| Manager dashboard + team analytics | $6K – $12K | Real-time field intelligence |
| Analytics + coverage + productivity reports | $5K – $10K | |
| AWS + VAPT + Year 1 ops | $5K – $10K | |
| Total | $73K – $142K | Full field force platform |
EngineerBabu built field operations intelligence for Simba Beer and enterprise operations for Adani Group. CMMI Level 5. Google AI Accelerator 2024 Top 20. Contact: mayank@engineerbabu.com
A Permanent Journey Plan (PJP) is a recurring weekly or monthly schedule that defines which salesperson visits which outlets on which day. It is “permanent” in the sense that it repeats every cycle, the same salesperson visits the same outlets on the same days every week, building retailer relationships and creating predictable order patterns. PJP optimisation uses route planning algorithms to group outlets into daily beats that minimise total travel time while ensuring every outlet is visited at its required frequency. Fast-moving outlets in high-priority segments require daily or twice-weekly visits. Standard outlets are visited weekly. Low-priority outlets may be visited fortnightly. The optimisation balances visit frequency requirements, geographic proximity, and the salesperson’s achievable call rate per day.
A field force app designed for FMCG field sales must operate fully offline because a significant portion of retail coverage, rural markets, industrial areas, building interiors, has poor or no cellular data coverage. The offline architecture works as follows: the app caches all required data locally on the device before the salesperson leaves for their beat, outlet list, product catalogue with prices and schemes, current stock levels, previous order history. During the visit, all interactions, GPS check-in, order booking, call report, photos, are written to local device storage. When cellular connectivity is restored, typically when the salesperson reaches an area with coverage or returns to base, the app synchronises all cached data to the cloud server automatically. The critical design requirement is that the salesperson cannot tell the difference between connected and offline operation, the app behaves identically in both modes.
Pre-sales is the model where the salesperson visits the outlet, books an order, and the order is subsequently fulfilled from the distributor, typically the next day or later that week. The salesperson carries no stock. Van sales is the model where the salesperson carries inventory in their vehicle and fulfils orders immediately from van stock, the retailer pays and receives goods in the same visit. Van sales is common in beverages, dairy, and bakery distribution where retailers prefer immediate availability. Field force automation handles both models: in pre-sales mode, the order is routed to the distributor system for fulfillment; in van sales mode, the app manages the van’s inventory in real time, decrementing stock with each sale, tracking van load and unload at day start and end, and reconciling van inventory against orders placed at day close.