How to Build a Liquor Distribution Sales and Incentive Platform - Retailer Intelligence, Rebate Automation, GPS Verification 2026


Create engaging, high-performance mobile applications tailored to your business needs. We craft future-ready apps that offer smooth user experiences on all devices.
Build robust and scalable websites and CMS platforms that help you manage content effortlessly. Our development ensures a seamless digital presence.
Launch secure, feature-rich online stores with intuitive shopping experiences. We build tailored eCommerce platforms designed for growth.
Design captivating games with immersive gameplay and stunning graphics. From concept to launch, we build engaging experiences that players love.
Enhance your customer relationships with customized Salesforce implementations. Drive growth and efficiency with smarter CRM solutions.
Harness artificial intelligence and machine learning to automate workflows and gain actionable insights. Our AI transforms data into smart decisions.
Accelerate your software delivery lifecycle with continuous integration, delivery, and infrastructure automation to boost efficiency.
Hire app developers ready to turn your ideas into sleek, high-performing mobile apps for any platform.
Bring in frontend pros who craft smooth, beautiful, and user-friendly interfaces that your visitors will love.
Get backend developers who build fast, secure, and reliable systems to keep everything running behind the scenes.
Hire eCommerce developers who build secure, scalable online stores designed to offer seamless shopping and grow your sales.
Get dedicated developers committed to your projects, delivering consistent quality and speed as an extension of your team.
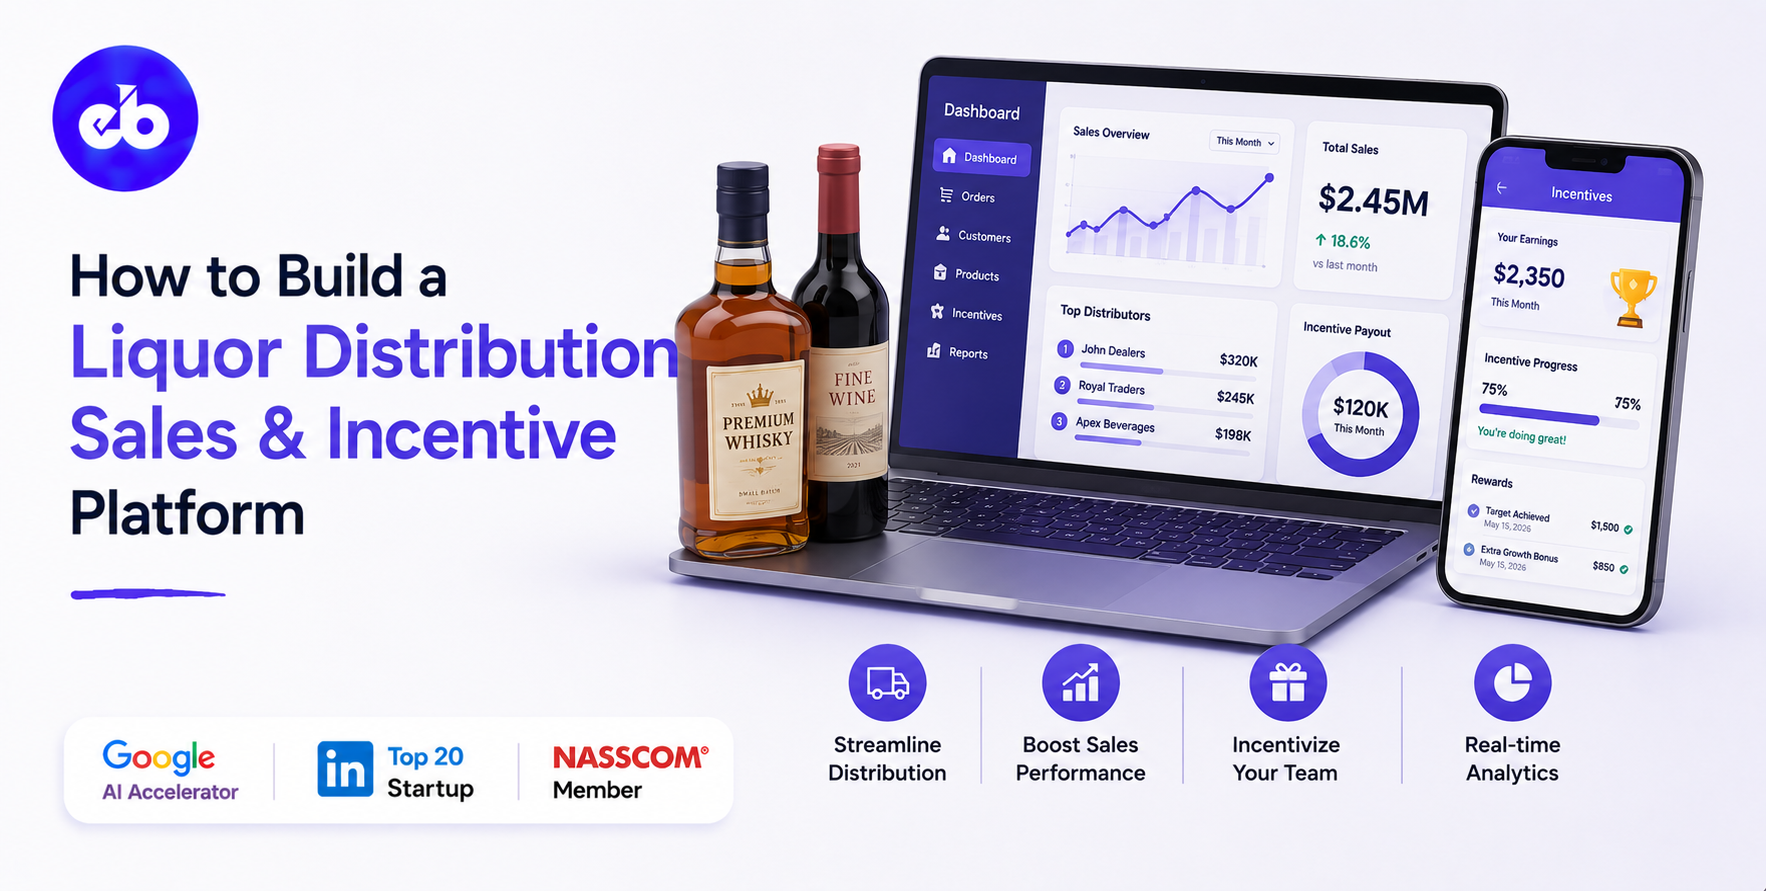
Most liquor distributors have a data problem disguised as a sales problem. The product is moving. The field team is active. The retailers are placing orders. But nobody knows which outlets are driving real volume, which incentives are actually working, which field salesperson influenced a decision, or where market share is quietly bleeding to a competitor.
The Indian alcobev market is expected to cross USD 312.4 billion by 2036. It is regulated, fragmented, margin-sensitive, and relationship-driven. At that scale, running distribution on WhatsApp updates, spreadsheet rebate calculations, and fragmented government portal data is not just inefficient, it is a structural ceiling on growth.
This guide covers how to build a liquor distribution sales and incentive platform, one that turns retailer sales data into market action, automates rebates without disputes, gives field teams context before every visit, and gives management a single operating view across every district.
EngineerBabu built AI-powered supply chain intelligence for Simba Beer and operations management for Adani Group. CMMI Level 5. Google AI Accelerator 2024 Top 20. If you are building this, contact mayank@engineerbabu.com
A distributor operating 20 outlets in one district can manage with spreadsheets and local relationships. The same distributor operating 800 outlets across 12 districts cannot.
The breakdown happens in five places simultaneously.
Retailer data is fragmented. Government systems report volume by permit or by outlet, but the format is inconsistent, the frequency is irregular, and nobody has reconciled it against the distributor’s own dispatch records.
The result: you know how much product left the warehouse. You rarely know exactly where it went, how fast it moved, and which outlets are sitting on dead stock.
Incentive calculations are manual and disputed. Rebate schemes are designed at the top, communicated loosely to the field, calculated at month-end by someone with a spreadsheet, and then disputed by retailers who got a different number in their head. Every manual calculation is a delay and a potential relationship problem.
Field intelligence is anecdotal. The sales team reports back what they saw. But there is no structured record of who they spoke to, what the shelf looked like, what the retailer’s competitor preference is, or whether the visit actually happened at the location it was claimed to happen at.
Market share is invisible. The distributor knows their own volume. They rarely know what share of total category demand they are capturing at an outlet, district, or state level. Without that context, incentive budgets go to the wrong places.
Management reporting is retrospective. By the time a district-level report is consolidated, the situation on the ground has already changed. Decisions made on last month’s numbers are not decisions, they are reactions.
A platform fixes all five. Not all at once. In phases. But the architecture needs to be designed for all five from the start.
Before discussing any module, the business outcomes must be clear. A liquor distribution platform is not a reporting tool. It is an operating system for a sales-intensive, relationship-driven, regulated business.
| Module | Business Outcome |
| Retail sales data ingestion | Single source of truth for outlet-level movement |
| Retailer profiling and CRM | Know who drives the decision at every outlet |
| Incentive and rebate automation | No disputes, no delays, no manual reconciliation |
| Field force app with GPS verification | Accountability without micromanagement |
| Market share and competitor analytics | Know where you are winning and where you are losing |
| Management MIS and reporting | Real decisions, not reactions |
| Automated WhatsApp communication | Incentive statements and alerts that retailers actually read |
| Supplier-facing analytics (optional Phase 2) | A premium service layer for brand partners |
The sequence matters. Build the data backbone first. Add the operational layers on top. The mistake most distributors make is trying to launch the field app and the incentive automation before the data layer is reliable.
The field team loses faith in a system that shows wrong numbers, and adoption collapses.
The foundation of everything else is structured, reliable, daily data at the outlet level.
In regulated liquor markets, most Indian states, retail sales data exists in government systems. It may come through state excise portals, permit management systems, or DMS (Distributor Management System) feeds.
The format varies by state. The field names vary. The outlet naming conventions are inconsistent. A shop called “M/S Rakesh Wine House” in one report appears as “Rakesh Wine Store” in another and “RWH” in a third.
The ingestion engine must handle all of this without manual cleanup.
What the ingestion pipeline handles:
| Data Source | Format | Processing Required |
| State excise portal exports | PDF, Excel, CSV – varies by state | Parse + normalise + map to master outlet list |
| Government DMS feed | API (some states) or scheduled export | Direct mapping to standard schema |
| Distributor ERP dispatch records | CSV or database export | Join with government data for variance analysis |
| Field team manual input | Mobile app entry | Validation against master outlet list |
The normalisation engine does three things. It resolves outlet identity, mapping every variant of a store name to a single master outlet record using fuzzy matching.
It standardises field names across data sources, permit numbers, MRP, quantity, brand, district, and date all map to the same internal schema regardless of source format.
And it runs data quality checks. flagging records with missing mandatory fields, impossible quantities, or dates that fall outside the reporting window.
Once the data is normalised, it never needs to be touched manually again. Every downstream feature, retailer profiling, incentive calculation, competitor analytics, MIS reporting reads from the same clean data layer.
The outlet master record:
| Field | Details |
| Outlet ID | Platform-assigned unique identifier |
| Outlet name | Canonical name + all known variants |
| License number | Government-issued licence ID |
| District and locality | Standardised geography |
| Category/tier | Gold / Silver / Standard (set by distributor) |
| Assigned salesperson | Current field owner |
| Key decision-maker | Owner / Manager / Purchasing contact |
| Sales history | Rolling 12 months by brand and SKU |
| Competitor presence | Brands stocked by this outlet |
| Last visit date | From field app |
| Incentive eligibility | Current scheme and accrual |
This master record becomes the single reference for every other module. Every piece of the platform reads from it and writes back to it.
Transaction data tells you what moved. Retailer profiling tells you why and more importantly, who to influence next time.
In liquor distribution, the sales decision at an outlet is rarely made by one person. In a standalone wine shop, the owner is usually the decision-maker. In a larger outlet with a dedicated purchasing team, a manager or senior staff member may influence stocking more than the owner does.
In some outlets, a specific salesperson relationship drives the order regardless of what the owner thinks.
A distributor who does not know this is running a spray-and-pray field operation. A distributor who knows exactly which contact type drives purchase decisions at each outlet can allocate field time, incentives, and relationship management with precision.
The retailer profile structure:
| Category | Fields Captured |
| Business identity | Name, license, location, category |
| Decision-maker 1 | Name, role, phone, contact preference, relationship strength |
| Decision-maker 2 | Name, role, phone, notes |
| Sales influence map | Which contact has historically driven orders |
| Purchase pattern | Typical order size, order frequency, preferred brands |
| Competitor intelligence | Which other brands are stocked, estimated share |
| Engagement history | Visit log, conversation notes, issues raised |
| Incentive sensitivity | Has this outlet responded to past rebate schemes? |
| Growth potential | Based on area demand vs current purchase volume |
The profile is built over time, not on day one. The platform starts capturing structured notes from every field visit and every interaction. Over three to six months, patterns emerge. The system starts flagging which outlets are underperforming relative to their area potential.
It starts showing which contact type has the highest correlation with order conversion. The distributor’s understanding of their own market gets sharper every week.
Retailer tiering sits on top of profiling. The distributor defines what Gold, Silver, and Standard mean, it might be based on monthly volume, category penetration, growth rate, or strategic location. The platform assigns and updates tiers automatically based on actual performance data, not subjective classification.
This is where most distributors leak money and relationships simultaneously. Incentives are a powerful sales tool when they are transparent, timely, and tied to measurable behaviour. They are a source of disputes and mistrust when they are manual, opaque, and inconsistently applied.
The automation layer removes the manual work entirely.
The incentive engine handles:
| Incentive Type | How It Is Calculated | When It Is Communicated |
| Per-case rebate | Units sold × rebate rate per SKU | Monthly – auto-calculated from sales data |
| Tier-based bonus | Outlet reaches volume threshold for the month | Real-time tracking, statement at month-end |
| District-wise scheme | Special slab active for a specific geography or period | Applied automatically when outlet is in the zone |
| Decision-maker incentive | Tied to a specific contact at the outlet, not the outlet itself | Calculated separately, communicated to that individual |
| Brand-specific push | Higher rebate on a specific SKU for a defined period | Activated by brand team, applied automatically |
| Growth incentive | Current month vs same month last year | Calculated from historical data |
The calculation workflow:
Every night, the engine processes the day’s sales data. It applies all active incentive rules to every qualifying outlet. It updates each outlet’s running accrual in real time.
At month-end, it generates a complete incentive statement per outlet, showing every transaction that counted, the rebate applied per transaction, and the total accrual.
The statement is automatically sent to the relevant contact at the outlet via WhatsApp. It shows exactly how the number was calculated. The field salesperson receives a copy showing their outlets’ performance. The district manager sees a summary across all outlets in their territory. The finance team sees a consolidated payout report ready for processing.
No spreadsheets. No manual calculations. No disputes about whether the numbers are right. If a retailer has a question, they can see the exact transaction-level detail in the statement.
The incentive rule builder:
The platform has a no-code rule builder. The commercial team defines: which outlets qualify, which SKUs are in scope, what the rebate rate is, whether there is a minimum threshold, whether the scheme is additive or exclusive, and when it starts and ends. The rule is activated, and the engine applies it automatically from that point forward.
This matters because incentive schemes change frequently in distribution. A new brand launches and needs a push. A district is underperforming and needs a temporary boost. A competitor is gaining share in a specific region and the distributor needs to respond quickly. A rigid system that requires IT involvement to change a scheme will always be too slow. A no-code rule builder lets the commercial team move at market speed.
The field team is the distributor’s most expensive resource and the one with the most influence over day-to-day sales outcomes. The platform must give them context before every visit and accountability after every visit, without making the app feel like a surveillance tool.
The field app has two jobs. First, it gives the salesperson information they can use in the visit. Second, it captures what happened in a way that is useful for the organisation.
What the salesperson sees before a visit:
| Information | Source | Why It Matters |
| Outlet’s sales trend last 30 days | Normalised sales data | Is this outlet growing, declining, or flat? |
| Brand-level performance vs district average | Comparative analytics | Which SKUs have room to grow? |
| Current incentive opportunity | Incentive engine | What can they offer this retailer today? |
| Key decision-maker and contact history | Retailer profile | Who to talk to and what was discussed last time |
| Outstanding issues | Notes from previous visits | What needed follow-up? |
| Competitor presence | Profile data | What is the retailer stocking from competitors? |
| Visit objective | Platform-assigned based on outlet priority | Why is this visit happening today? |
This changes the conversation. Instead of a salesperson walking in with nothing but general product knowledge, they walk in knowing the retailer’s specific situation. They can open with something specific, “I noticed your Scotch movement dropped last month, let me show you what I can offer”, instead of a generic pitch.
What the salesperson captures after the visit:
| Captured Data | Input Method | Validation |
| Visit confirmation | GPS check-in + photo | GPS must match outlet location within 200 metres |
| Shelf placement photo | In-app camera (no gallery upload) | Timestamped, GPS-tagged, live capture only |
| Stock availability observation | Structured form, brand by brand | Quick tap, not text entry |
| Conversation notes | Voice-to-text or typed | Unstructured field for context |
| Order captured | If the app supports ordering | Linked to outlet record |
| Next visit date | Committed date | Appears in the salesperson’s schedule |
The GPS fencing logic:
The photo verification feature is only useful if it cannot be gamed. The platform requires live camera capture, no gallery uploads allowed. It attaches GPS coordinates and a timestamp to every photo. It validates that the GPS coordinates fall within a defined radius of the outlet’s registered location. If the salesperson tries to submit a photo from outside this radius, the system flags it.
This does not eliminate all misuse. A creative field team member can still find ways around it. But the combination of live capture, GPS tagging, and radius validation catches the most common abuse patterns, uploading old photos, submitting photos from the car, or marking visits that did not happen.
Over time, the platform can add image intelligence, detecting duplicate photos, checking that the photo shows a retail shelf environment, or comparing photos to identify if the same image was submitted at different outlets. But this is a Phase 2 refinement. The first version focuses on operational control.
A distributor who only knows their own volume is flying half-blind. The question is never just “how much did we sell?” The real question is “how much of the available market did we capture?”
In a regulated market where government data captures total category movement at the outlet or district level, this comparison is possible. The platform calculates the distributor’s share of total category movement, district by district, brand by brand, month by month.
The market share views:
| View | What It Shows | Business Decision It Enables |
| District-wise market share | Distributor’s share of total category volume in each district | Which districts need more field investment? |
| Outlet-level share | Distributor’s brands as a percentage of each outlet’s total purchases | Where is the distributor underperforming relative to category demand? |
| Brand-level share | How each brand performs relative to category | Which brands need a push? Which are naturally strong? |
| Trend analysis (month-on-month) | Share movement over time | Is the distributor gaining or losing ground? |
| Year-on-year comparison | Same period last year | Is growth real or seasonal? |
| Competitor heatmap | Where competitor brands are strongest | Where should defensive incentives be deployed? |
The opportunity identification engine:
When the platform knows the total category demand in an outlet’s area and it knows the distributor’s current volume with that outlet, it can calculate a gap. An outlet in a high-demand zone that is purchasing less than its area potential is an opportunity.
The platform surfaces these gaps, ranked by potential value and suggests them as priority visits for the field team.
This shifts field planning from instinct to data. Instead of the district manager deciding which outlets to focus on based on experience and relationships, the platform shows exactly where the highest-value opportunities are. The field team’s time goes to the outlets with the most upside.
In India’s distribution ecosystem, WhatsApp is not optional infrastructure. It is the primary communication channel for trade relationships. If the platform sends incentive statements by email, most retailers will never see them. If they go to WhatsApp, they will be read.
The automated communication flows:
| Message Type | Recipient | Timing | Content |
| Monthly incentive statement | Retailer decision-maker | 1st of every month | Transaction-level detail, total accrual, payment timeline |
| Real-time scheme alert | Outlet contact | When a new scheme goes live | “A new rebate scheme is active for your outlet, here are the details” |
| Target progress update | Retailer | Mid-month | “You have reached 60% of your target — here is what you unlock at 100%” |
| Visit reminder | Salesperson | Day before scheduled visit | Outlet brief, objectives, decision-maker contact |
| Missing visit alert | Salesperson’s manager | When a committed visit is missed | Flag for follow-up |
| Competitor alert | District manager | When significant competitor movement is detected in a district | Anomaly flag |
The key principle is that communication should feel personal even when it is automated. A message that says “Your accrual for July is ₹4,280 based on 142 cases of Brand X and 67 cases of Brand Y” feels specific and credible. A message that says “Your incentive has been calculated” feels like a system message and gets ignored.
The platform generates message content from actual transaction data. The numbers are real. The specificity builds trust.
The platform must give management the visibility to make actual decisions, not just the ability to see more data.
The MIS layer answers the questions that matter to leadership:
Which districts are on track, which are lagging, and what is the reason? Where is incentive spend generating the most return, and where is it being wasted? Which salespeople are performing, and is their performance correlating with actual outlet growth or just visit activity? Which brands are gaining momentum and which need intervention?
The management dashboard:
| Report | Time Frequency | Primary User |
| Portfolio snapshot | Daily | CEO, COO, Sales head |
| District performance heatmap | Weekly | Regional managers |
| Brand movement trends | Weekly | Brand managers, commercial team |
| Incentive ROI analysis | Monthly | Finance, commercial |
| Salesperson productivity | Weekly | Sales managers |
| Retailer tier movement | Monthly | Commercial team |
| Competitor share report | Monthly | Leadership |
| Expansion opportunity map | Monthly | Strategy |
The exception queue:
The most useful part of management reporting is not the summary dashboards. It is the exception queue, a prioritised list of situations that require human attention. Outlets where sales have dropped more than 20% for two consecutive months.
Districts where market share is declining faster than the national average. Salespeople whose visit rate has fallen below threshold. Retailers who are enrolled in an incentive scheme but have not responded to it.
The exception queue tells the management team exactly where to look. It replaces the need for managers to dig through reports to find problems.
Once the distributor has a mature internal platform, a second commercial opportunity opens up. Suppliers, the brand companies whose products the distributor carries, want tertiary visibility. They want to know how their brands are performing on the ground, which regions are responding, and where execution gaps exist.
Most suppliers in regulated beverage markets lack this visibility. They see primary sales (what they shipped to the distributor) and secondary sales (what the distributor sold to retailers) but not tertiary movement (what retailers are actually selling to consumers, or what is moving through the licensed outlet network).
A distributor who can offer this data, presented cleanly and summarised intelligently has a premium service to sell.
What the supplier-facing module shows:
| Report | Supplier Value |
| Region-wise tertiary movement | Which markets are growing, which are flat |
| Outlet availability | What percentage of licensed outlets carry this brand |
| Share of category | How this brand performs relative to the total category |
| District-level heat map | Which geographies are strong, which need support |
| Execution compliance | Are retailers following the display and stocking agreements? |
| Month-on-month trend | Is the brand building momentum or declining? |
This can be offered as a monthly intelligence report for a fixed fee, or as dashboard access to a supplier portal. Either way, it transforms the distributor from a logistics provider into a data and intelligence partner. That is a materially different commercial relationship.
The biggest risk in building a distribution platform is trying to do everything at once. The second biggest risk is building too little and losing credibility with the team that needs to adopt it.
The phased approach delivers value at every stage while building toward the full platform.
Bring in the structured sales data. Build the outlet master. Normalise and validate the first month’s data. Give leadership the first clean management dashboard. This phase delivers immediate value and proves the data layer works before anyone else has to use it.
Deploy the field app. Start capturing visit data, shelf photos, and contact intelligence. Build retailer profiles from the first month of structured field input. The field team starts seeing useful outlet intelligence before every visit.
Activate the incentive engine. Run the first automated month-end calculation. Send the first WhatsApp incentive statements. Handle the first round of questions and disputes, which will be significantly fewer than with the manual process.
Layer in the competitor comparison and market share views. Give the management team the district-level visibility they need to make incentive and field deployment decisions.
Once the platform is stable and trusted internally, build the supplier-facing layer. Monetise the data intelligence that the platform is already generating.
| Layer | Technology | Reason |
| Backend | Python FastAPI + Node.js | Python for data processing and analytics; Node.js for real-time APIs |
| Database | PostgreSQL + Redis | Relational integrity for outlet/incentive data; Redis for real-time dashboards |
| Data ingestion | Apache Kafka + custom parsers | Handle high-volume, multi-format government data feeds |
| Analytics | Apache Superset or custom React dashboard | Flexible, configurable MIS layer |
| Mobile (field app) | Flutter | Single codebase for iOS and Android; offline capability for poor network areas |
| Maps and GPS | Google Maps Platform | Geofencing, outlet location mapping |
| WhatsApp messaging | Meta WhatsApp Business API | Automated incentive statements and alerts |
| Image processing | AWS Rekognition (Phase 2) | Shelf compliance image validation |
| Cloud | AWS (Mumbai region) | Data residency, compliance, performance |
| Security | AES-256 at rest, TLS 1.3 in transit, RBAC | Sensitive trade data protection |
| Module | Cost Range (USD) | Notes |
| Data ingestion + normalisation engine | $8K – $15K | Multi-format parser, outlet master, fuzzy matching |
| Retailer profiling and CRM | $6K – $12K | Profile builder, contact intelligence, tier management |
| Incentive and rebate automation engine | $8K – $15K | Rule builder, accrual engine, statement generation |
| Field force mobile app (Flutter) | $10K – $18K | iOS + Android, GPS fencing, offline mode |
| Photo verification module | $4K – $8K | Live capture, GPS tagging, timestamp validation |
| Market share and competitor analytics | $6K – $12K | District-level share, trend analysis |
| WhatsApp automated communication | $4K – $8K | Meta API integration, template management |
| Management MIS dashboard | $6K – $12K | Executive dashboards, exception queue |
| Admin panel (user management, rule builder) | $4K – $8K | Internal operations |
| AWS setup + security + VAPT | $5K – $10K | Production-grade deployment |
| Total — Phase 1 to 4 | $61K – $118K | Full platform across 6–7 months |
| Supplier analytics portal (Phase 5) | $8K – $15K | Premium service layer |
EngineerBabu built AI-powered supply chain intelligence for Simba Beer and operations management for Adani Group. If you are building a distribution platform, start with a conversation: mayank@engineerbabu.com
A distribution platform fails for one of three reasons. The data is wrong, so nobody trusts it. The app is too complex, so the field team abandons it. The incentives are not transparent, so retailers stop believing the numbers.
The data problem is solved at Phase 1. Do not move to Phase 2 until the first two months of data have been validated against known ground truth, even if that validation is manual. The field team needs to see correct numbers before they will trust the system with their daily workflow.
The adoption problem is solved by designing for the salesperson first, not for the manager. The field app must be useful in a two-minute visit. If it takes longer than that to complete the required inputs, it will not get used.
Start with minimal required fields, visit confirmation, one photo, one structured observation. Add complexity only after the habit is established.
The incentive transparency problem is solved by the statement design. When a retailer opens a WhatsApp message and sees their exact transaction history, 47 cases of Brand A on July 3, 31 cases of Brand B on July 12, total accrual ₹3,840, they cannot dispute it. Transparency is the best dispute resolution mechanism.
A liquor distribution software platform is an integrated operating system that helps licensed distributors manage retailer sales data, field force operations, incentive and rebate automation, market share analysis, and management reporting from a single system. It replaces fragmented spreadsheets, manual calculations, and WhatsApp-based coordination with structured workflows tied to actual sales data. The platform typically ingests data from government excise systems or distributor ERP records, normalises it to an outlet-level master, and provides dashboards and mobile tools for sales teams, district managers, and company leadership. It is most valuable for distributors operating across multiple districts or states where manual visibility breaks down.
Retailer incentive automation works by defining commercial rules in a no-code rule builder, specifying which outlets qualify, which SKUs are in scope, what the rebate rate per case or per unit is, and whether volume thresholds apply. The engine then runs every night, processing actual sales data and calculating each outlet’s accrual based on the active rules. At month-end, the engine generates itemised incentive statements showing each qualifying transaction, the rebate applied, and the total payout. These statements are automatically sent to the retailer’s WhatsApp contact. The entire process, from data input to statement delivery, requires no manual spreadsheet work, eliminating calculation disputes and reducing the time between performance and payout.
GPS photo verification is a feature in the field force mobile app that requires salespeople to capture shelf placement and in-store compliance photos using the device’s live camera, gallery uploads are blocked. Every photo is automatically tagged with GPS coordinates and a precise timestamp at the moment of capture. The platform then validates that the GPS coordinates fall within a defined radius, typically 150 to 300 metres of the outlet’s registered address. If the photo is taken outside this zone, it is flagged and routed to the salesperson’s manager. This combination of live capture, GPS tagging, and location validation prevents the most common forms of field execution misreporting without requiring manual oversight of every submission.
Market share in a regulated liquor distribution market is calculated by comparing the distributor’s outlet-level sales volume against the total category movement at that outlet or in that geography, as reported through government excise data. When both the distributor’s own dispatch records and the government’s retail sales data are ingested into the same platform and normalised to the same outlet identifiers, the platform can calculate the distributor’s brands as a percentage of total licensed retail movement, district by district and brand by brand. This gives the distributor a view not just of their own volume but of how much of the available market they are capturing, where gaps exist, and where competitor brands are gaining ground faster than the distributor’s own growth.
A full liquor distribution platform covering data ingestion, retailer profiling, incentive automation, field force app with GPS verification, market share analytics, and management MIS typically costs between $61,000 and $118,000 across four development phases spanning six to seven months. Phase 1, data foundation and MIS, takes eight weeks and is typically the fastest-value phase, giving leadership their first clean dashboard. Phase 2 adds the field app and retailer profiling over the following eight weeks. Phase 3 activates incentive automation. Phase 4 adds competitor analytics. A supplier-facing analytics portal is an optional Phase 5 add-on at $8,000 to $15,000 additional. Costs vary based on the number of data source integrations, the complexity of incentive rules, and the number of states the distributor operates in.
A distribution platform is not a software project. It is an operating infrastructure decision. The companies that build it well gain compounding advantages, faster incentive response, better retailer relationships, smarter field deployment, and the ability to expand into new districts without losing control.
EngineerBabu has built supply chain intelligence for Simba Beer and enterprise operations for Adani Group. CMMI Level 5. Google AI Accelerator 2024 Top 20. 500+ products shipped across 20+ countries.
If you are evaluating whether to build this and want a real conversation about scope, architecture, and what it actually takes, write to mayank@engineerbabu.com.
No pitch. Just a conversation.