How to Build a Smart Building Platform, IoT Controls, Energy Management, Tenant Experience, and BMS Integration 2026


Create engaging, high-performance mobile applications tailored to your business needs. We craft future-ready apps that offer smooth user experiences on all devices.
Build robust and scalable websites and CMS platforms that help you manage content effortlessly. Our development ensures a seamless digital presence.
Launch secure, feature-rich online stores with intuitive shopping experiences. We build tailored eCommerce platforms designed for growth.
Design captivating games with immersive gameplay and stunning graphics. From concept to launch, we build engaging experiences that players love.
Enhance your customer relationships with customized Salesforce implementations. Drive growth and efficiency with smarter CRM solutions.
Harness artificial intelligence and machine learning to automate workflows and gain actionable insights. Our AI transforms data into smart decisions.
Accelerate your software delivery lifecycle with continuous integration, delivery, and infrastructure automation to boost efficiency.
Hire app developers ready to turn your ideas into sleek, high-performing mobile apps for any platform.
Bring in frontend pros who craft smooth, beautiful, and user-friendly interfaces that your visitors will love.
Get backend developers who build fast, secure, and reliable systems to keep everything running behind the scenes.
Hire eCommerce developers who build secure, scalable online stores designed to offer seamless shopping and grow your sales.
Get dedicated developers committed to your projects, delivering consistent quality and speed as an extension of your team.
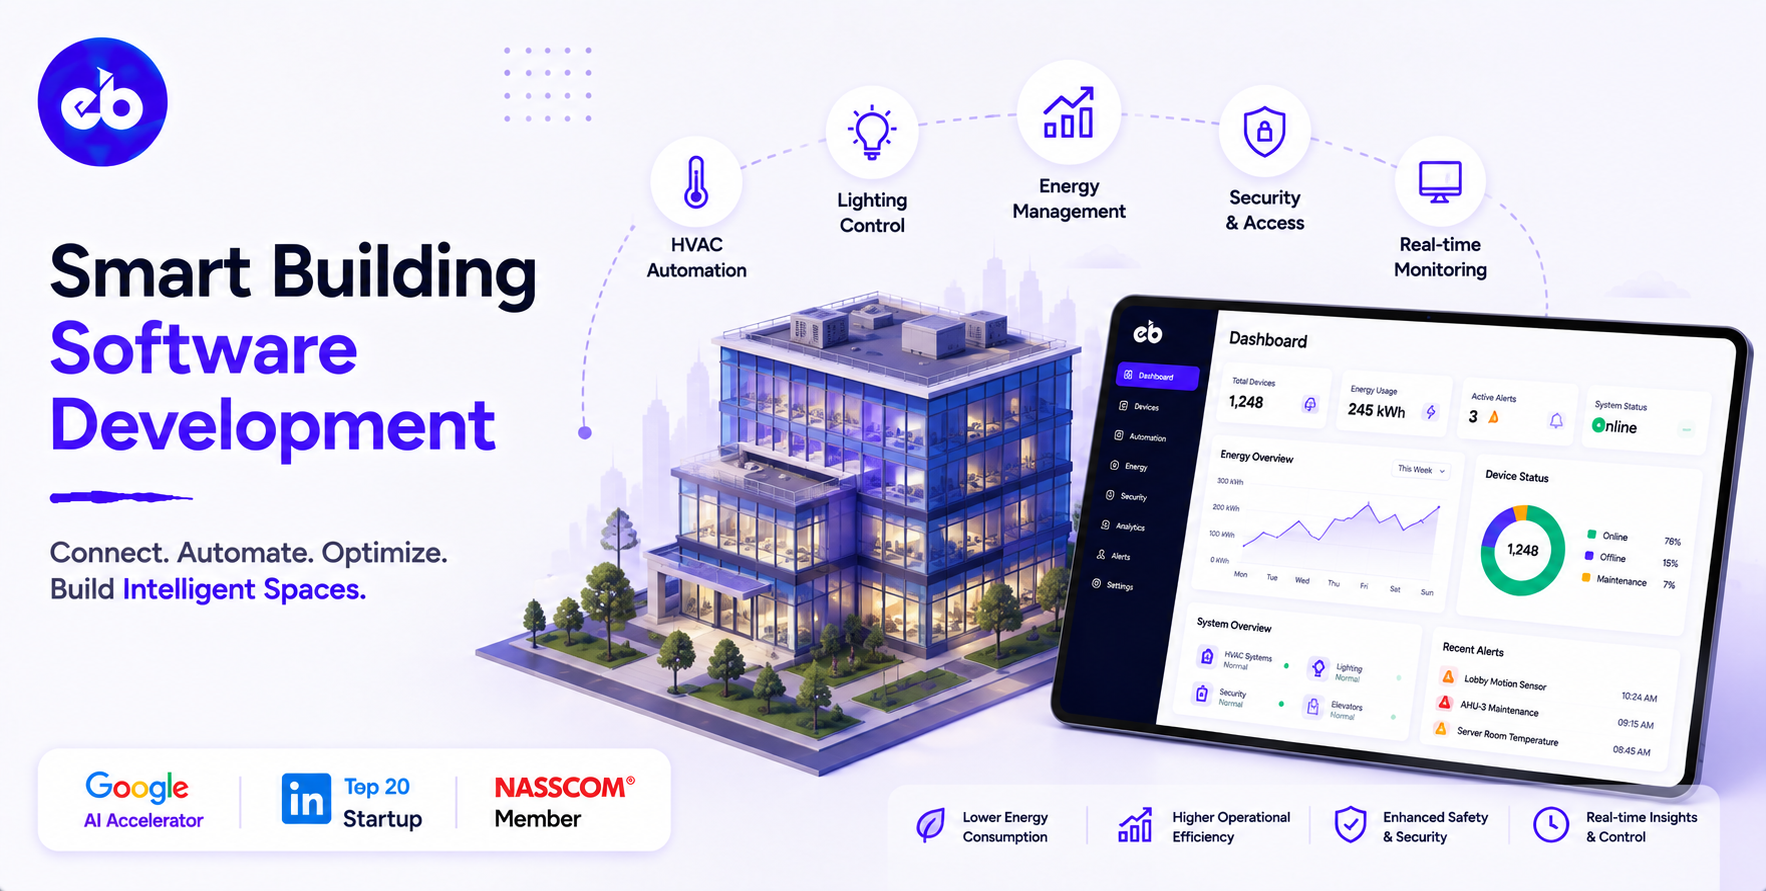
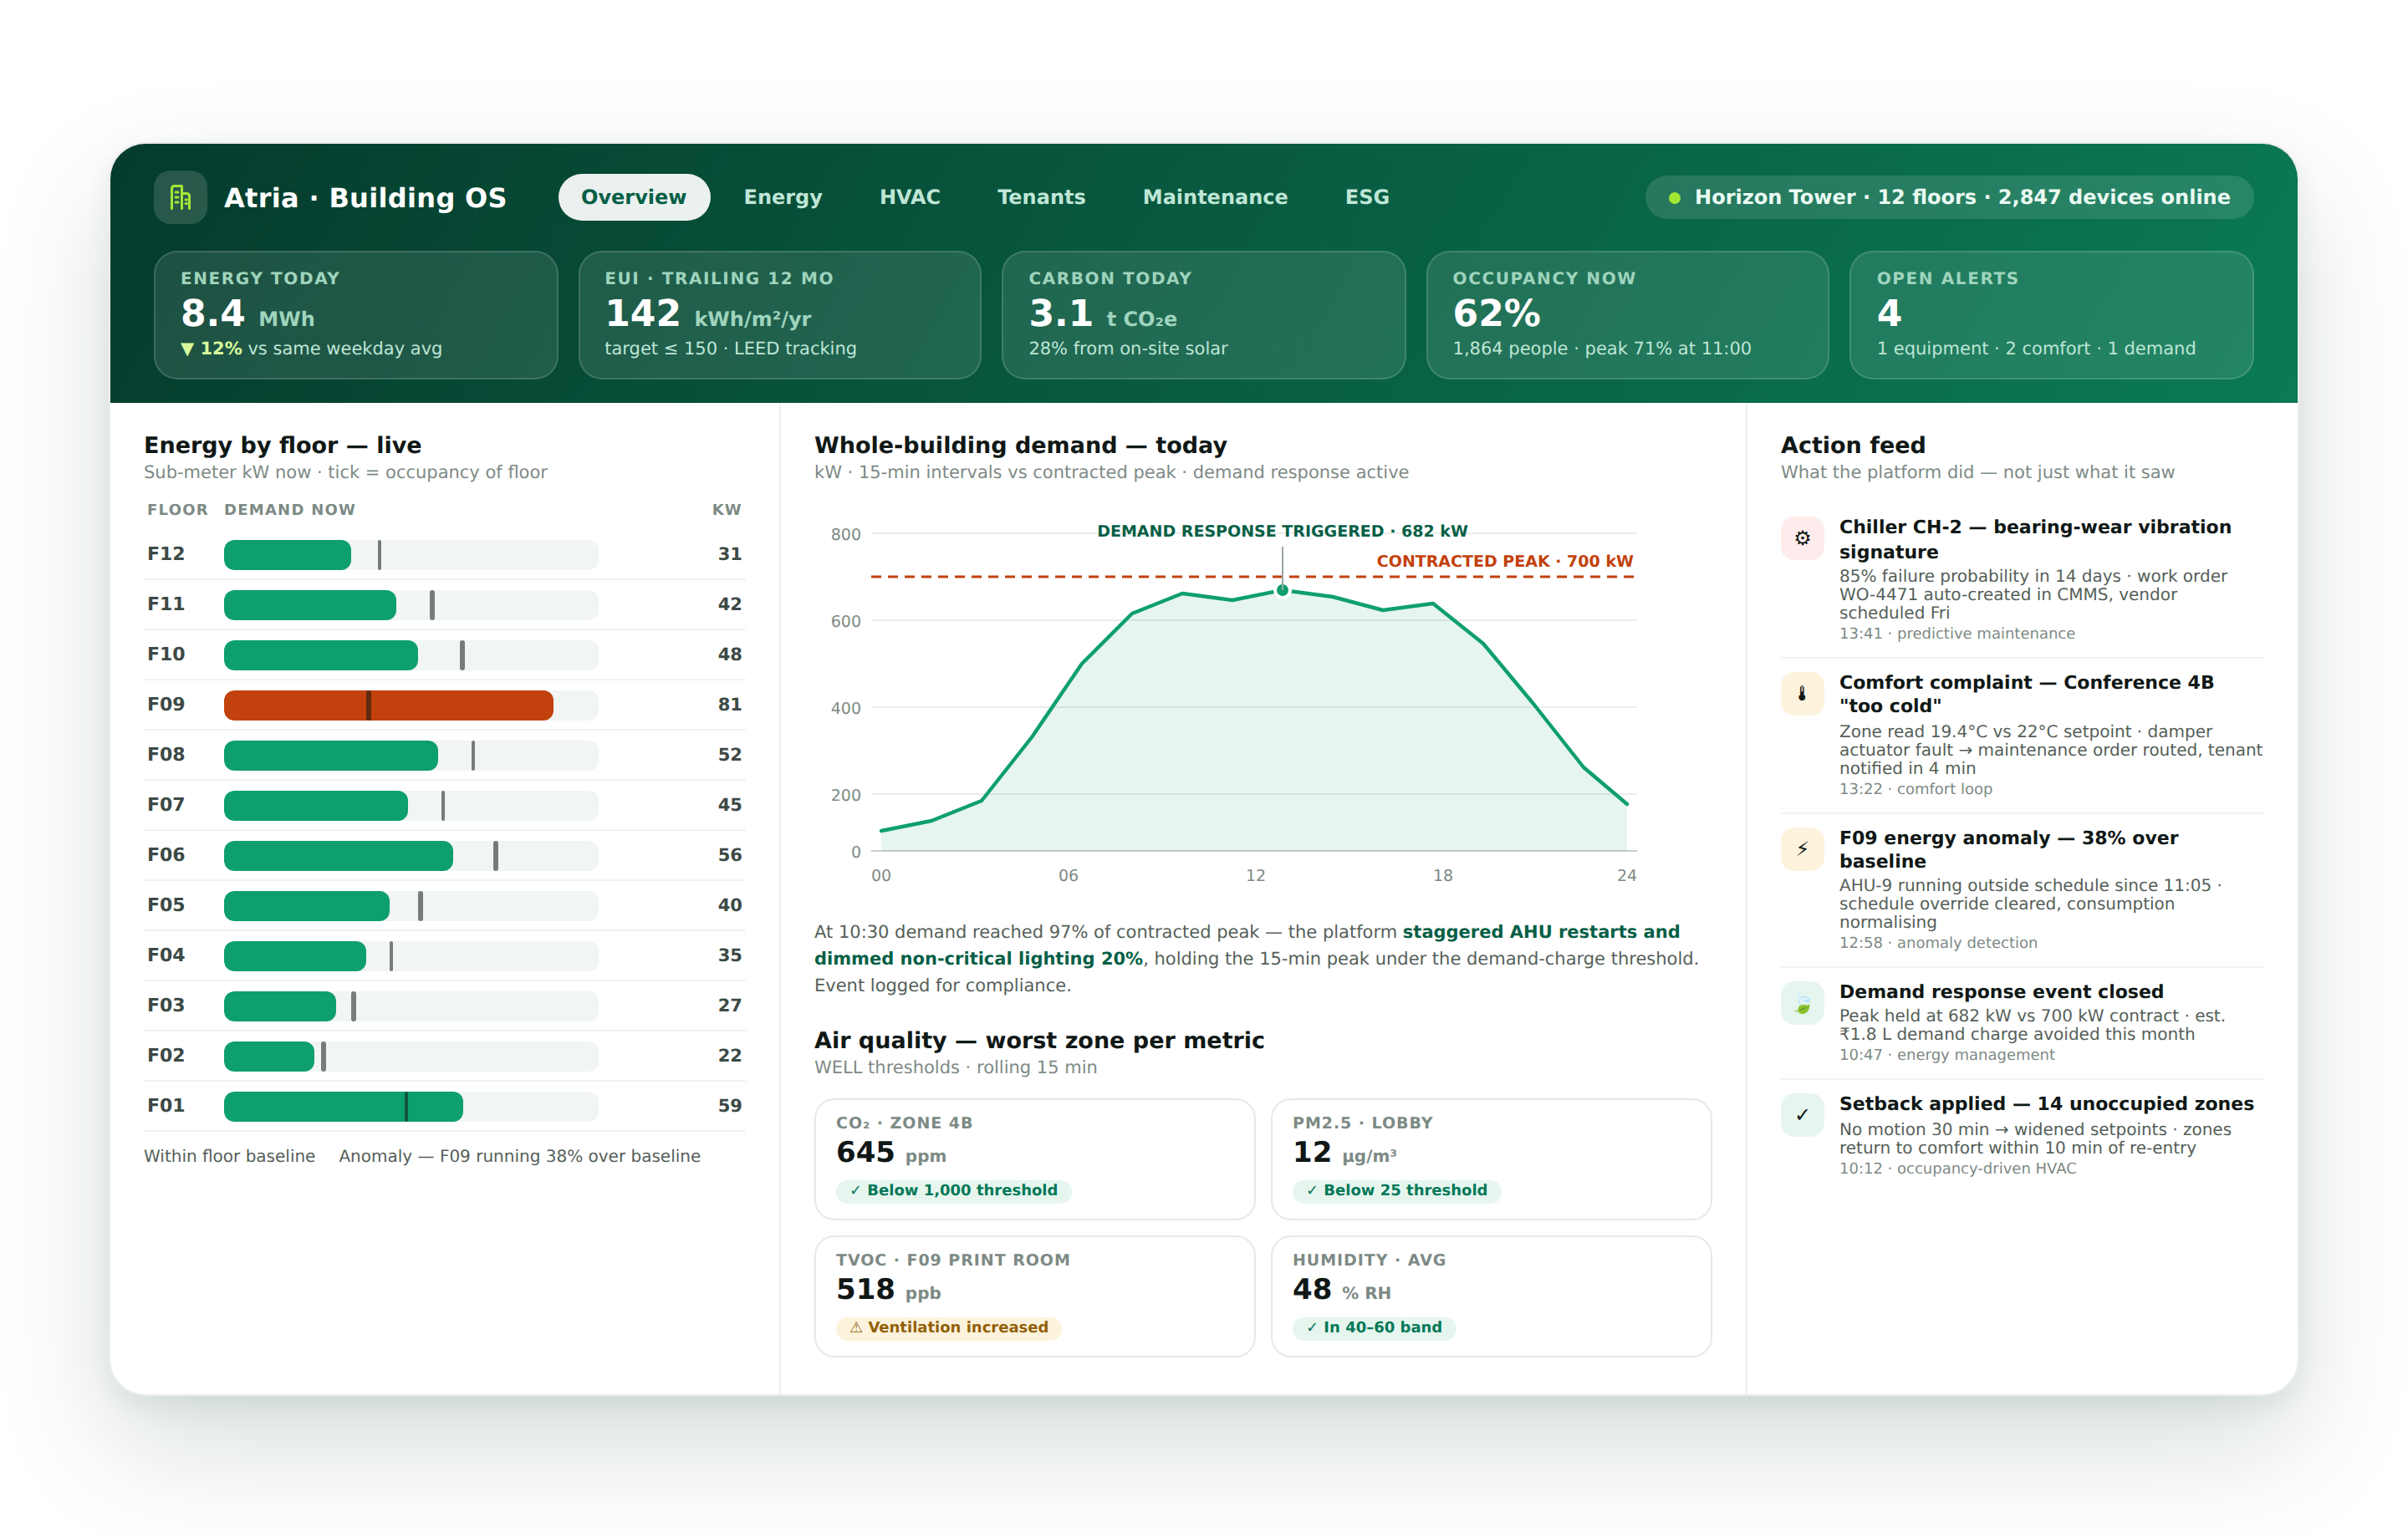
A modern commercial office building in 2026 is an IoT environment. HVAC systems with 200 sensors, lighting controls in every zone, access control at every door, energy submeters on every floor, elevator systems with predictive maintenance intelligence, and fire safety systems integrated with emergency protocols.
In most buildings, all of these systems run on separate proprietary platforms that do not talk to each other, managed by different vendors, with different dashboards, different alert systems, and no unified intelligence layer.
A smart building software development integrates all of these systems, connecting the IoT infrastructure to a single operating platform that gives facility managers real-time visibility, gives tenants a seamless building experience, and gives building owners the energy analytics and compliance reporting that LEED, WELL, and IGBC certification programmes require.
The global smart building market is projected to reach $570 billion by 2030 at a CAGR of 22.5%. The buyers are commercial real estate developers, REITs managing large office and retail portfolios, facility management companies, and corporate occupiers managing their own campuses.
EngineerBabu built IoT monitoring infrastructure for Somnoware (acquired by ResMed) and enterprise operations management for Adani Group, one of India’s largest infrastructure conglomerates actively deploying smart building technology. CMMI Level 5. Google AI Accelerator 2024 Top 20. Contact: mayank@engineerbabu.com
| Function | Module |
| BMS integration | Connect to existing Building Management Systems |
| IoT sensor management | Register, monitor, and manage all sensors |
| Energy management | Sub-metering, consumption analytics, peak demand control |
| HVAC control | Zone-level temperature, air quality, occupancy-driven control |
| Lighting control | Zone-level lighting, daylight harvesting, occupancy sensors |
| Access control | Card access, biometric, visitor management |
| Tenant experience app | Space booking, service requests, building amenities |
| Predictive maintenance | Equipment health, failure prediction, work orders |
| Safety and compliance | Fire safety integration, emergency protocols |
| ESG reporting | Carbon footprint, energy intensity, LEED/WELL reporting |
| Analytics dashboard | Facility manager view, all systems in one screen |
| Space utilisation | Occupancy analytics, space planning intelligence |
The integration challenge:
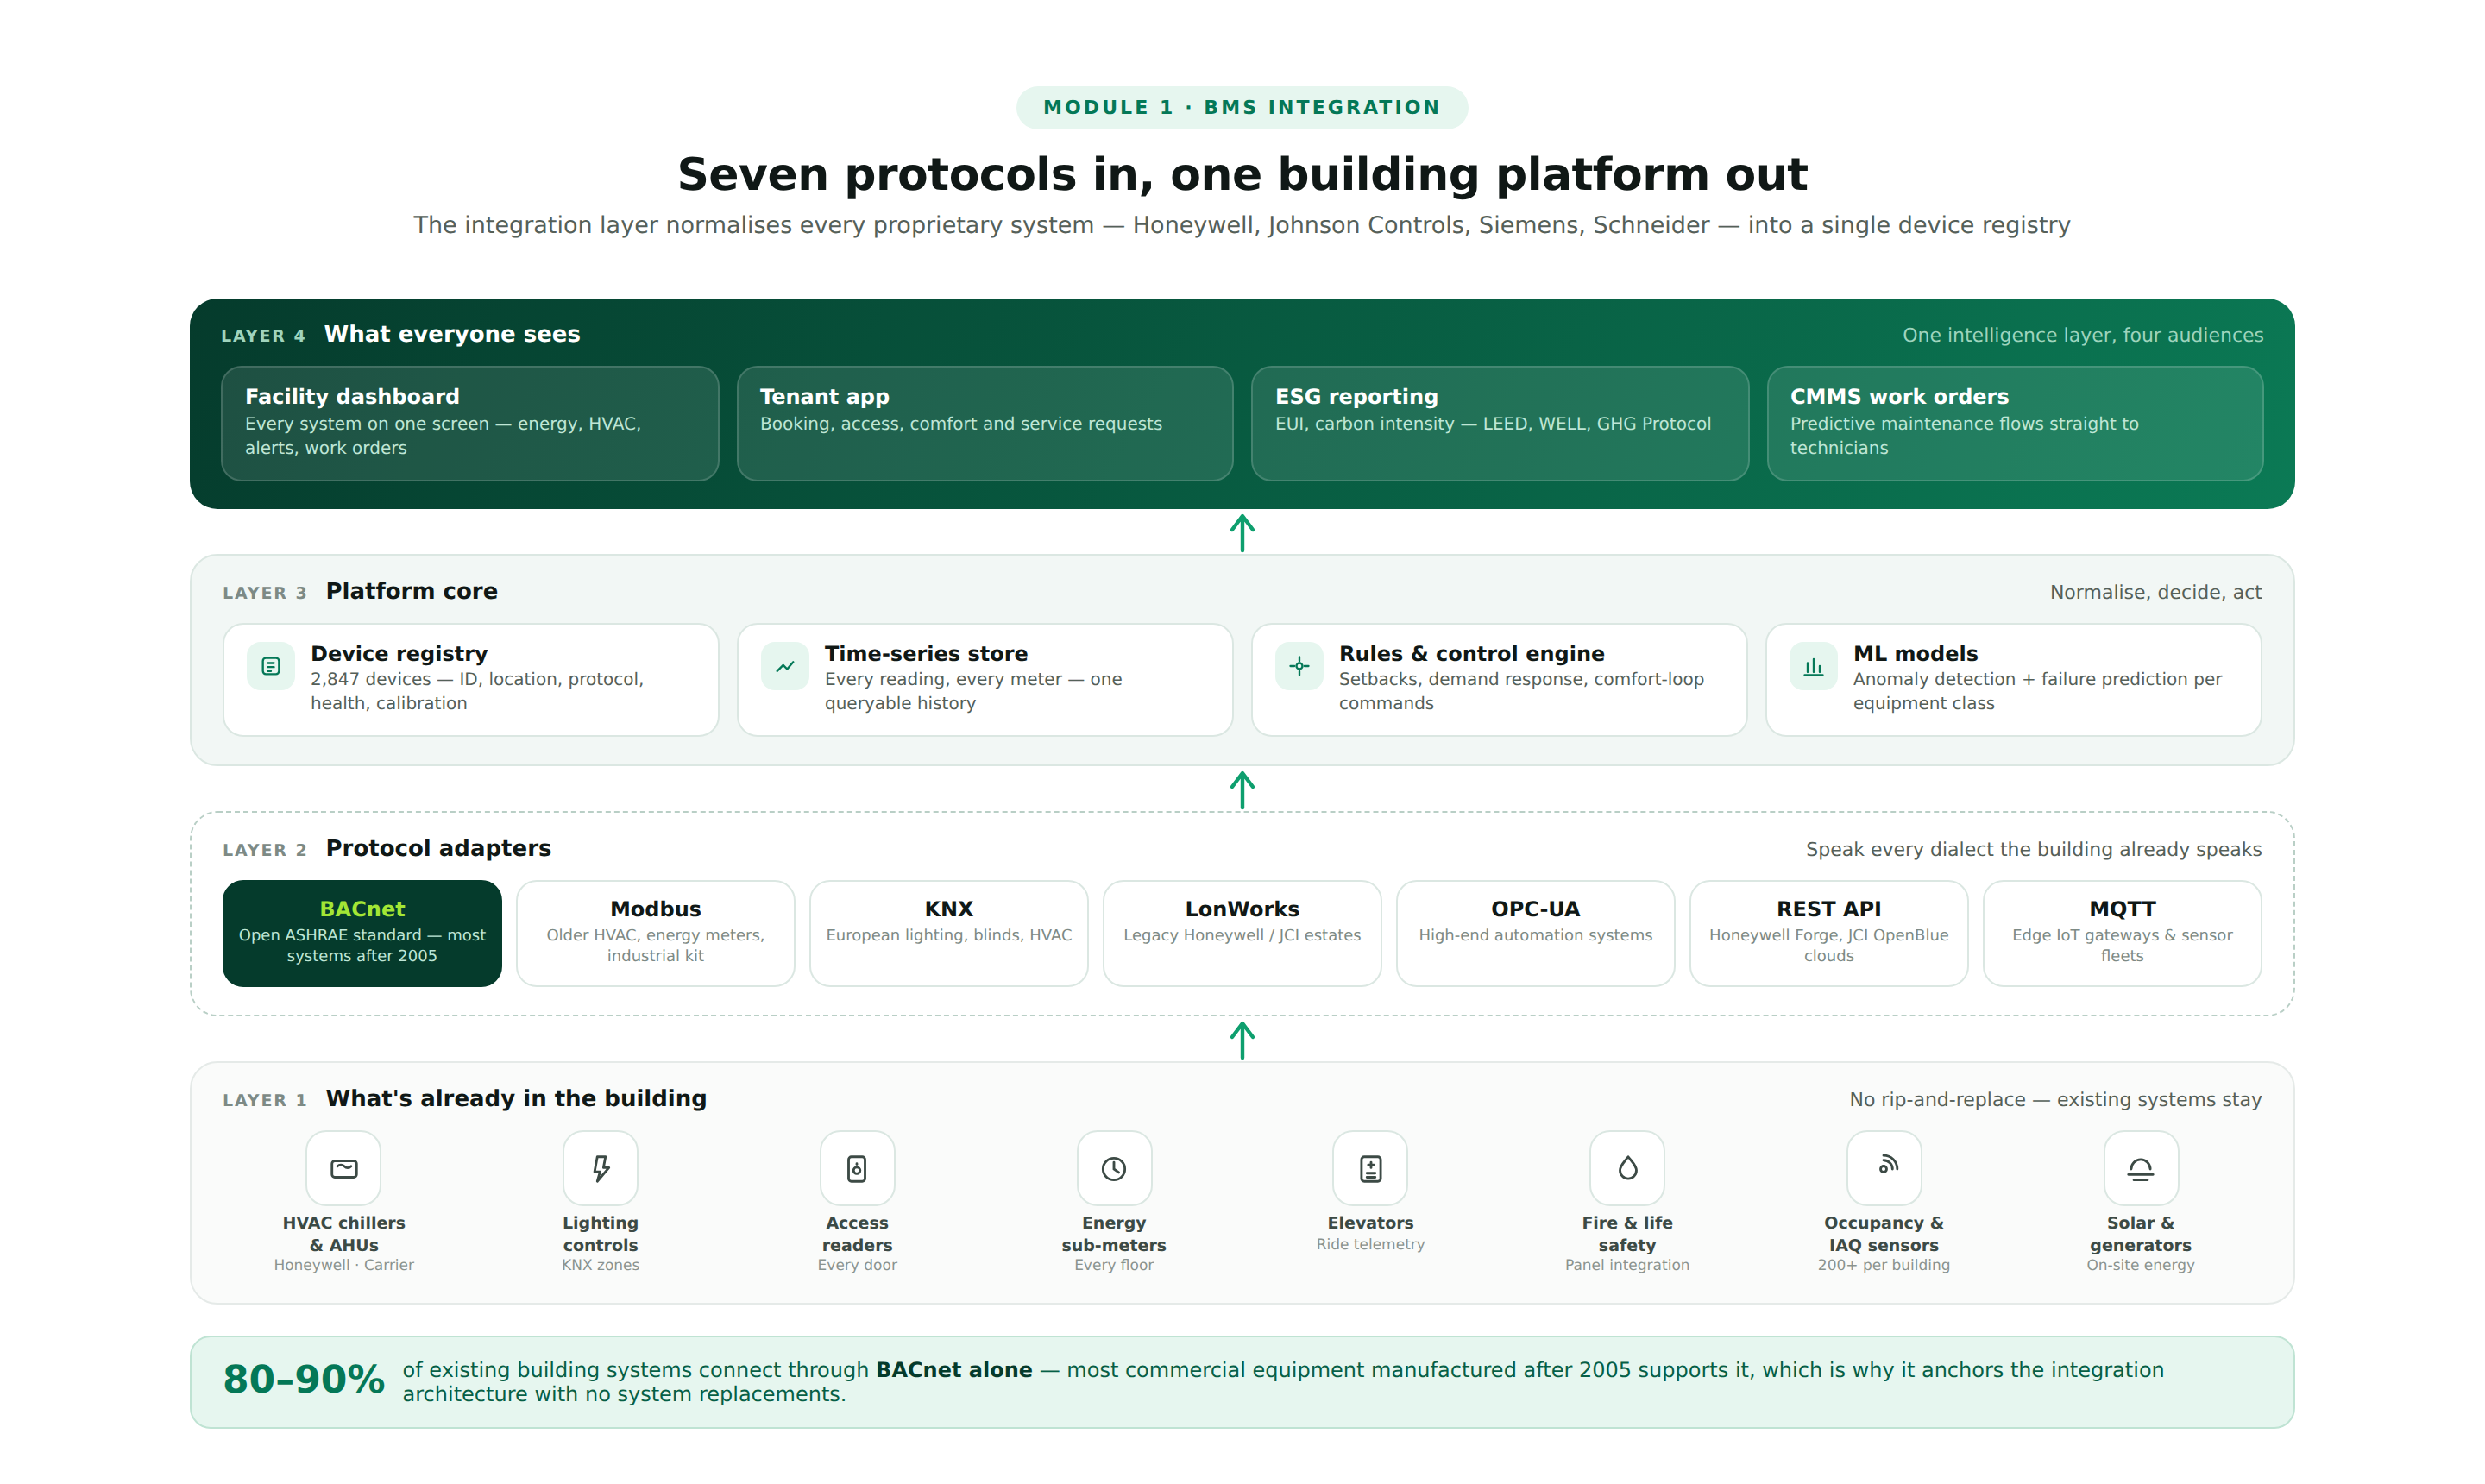
Most commercial buildings already have a Building Management System (BMS), proprietary systems from Honeywell, Johnson Controls, Siemens Building Technologies, or Schneider Electric.
These systems control HVAC, lighting, and other building services but expose limited data through proprietary interfaces.
BMS integration protocols:
| Protocol | Description | Systems Using It |
| BACnet | Open standard for building automation | Most modern HVAC, fire, lighting systems |
| Modbus | Industrial communication protocol | Older HVAC, energy meters, industrial systems |
| KNX | European standard for building automation | Lighting, blinds, HVAC in European buildings |
| LonWorks | Legacy Echelon protocol | Older Honeywell and Johnson Controls systems |
| OPC-UA | Industrial IoT standard | High-end building automation systems |
| REST API | Modern BMS vendors offering cloud APIs | Honeywell Forge, Johnson Controls OpenBlue |
| MQTT | IoT message protocol | Edge IoT gateways aggregating sensor data |
The device registry:
Every connected device, every sensor, every actuator, every meter, every access reader, is registered in the platform with:
| Field | Details |
| Device ID | Unique identifier |
| Device type | Temperature sensor, occupancy sensor, energy meter, access reader |
| Location | Building, floor, zone, room |
| Communication protocol | BACnet, Modbus, MQTT |
| Manufacturer and model | For firmware management and calibration |
| Installation date | For maintenance scheduling |
| Last communication timestamp | Connectivity health monitoring |
| Battery level | For battery-powered devices |
| Calibration due date | For metering devices |
The energy hierarchy:
| Level | Measurement | Equipment |
| Building total | Total energy consumption | Main utility meter |
| Floor level | Energy per floor | Floor-level sub-meters |
| Zone level | Energy per zone or tenant area | Zone sub-meters |
| Circuit level | Energy per circuit or large equipment | Circuit-level meters |
| Equipment level | Energy for specific equipment (HVAC units, lifts) | Equipment meters |
Real-time energy dashboard:
The energy dashboard shows consumption at every level of the hierarchy, in real time, by the hour, by the day, by the month. Managers see at a glance which floor, which zone, or which equipment type is consuming the most energy.
Historical trending shows whether consumption is improving or worsening against the baseline.
Peak demand management:
Electricity tariffs in India and many other markets include a demand charge component, a charge based on the highest 15-minute peak demand recorded in the billing period. A single unexpected spike, an HVAC system starting simultaneously with all office floors powering up, can significantly increase the month’s electricity bill.
The platform implements demand response, when the measured demand approaches the contracted peak demand threshold, the platform automatically: staggers HVAC zone restarts to prevent simultaneous power draws, dims non-critical lighting by 20%, sends alerts to large energy consumers (server rooms, cafeteria kitchens) to defer discretionary loads, and logs the demand response event for compliance reporting.
Energy benchmarking and ESG reporting:
| Report | Metric | Standard |
| Energy Use Intensity (EUI) | kWh per square metre per year | LEED, ASHRAE 90.1 |
| Carbon intensity | kg CO₂e per square metre per year | GHG Protocol |
| Renewable energy percentage | % of consumption from renewables | LEED, RE100 |
| Water use intensity | Litres per square metre per year | LEED, WELL |
| Waste diversion rate | % of waste diverted from landfill | LEED |
Occupancy-driven HVAC:
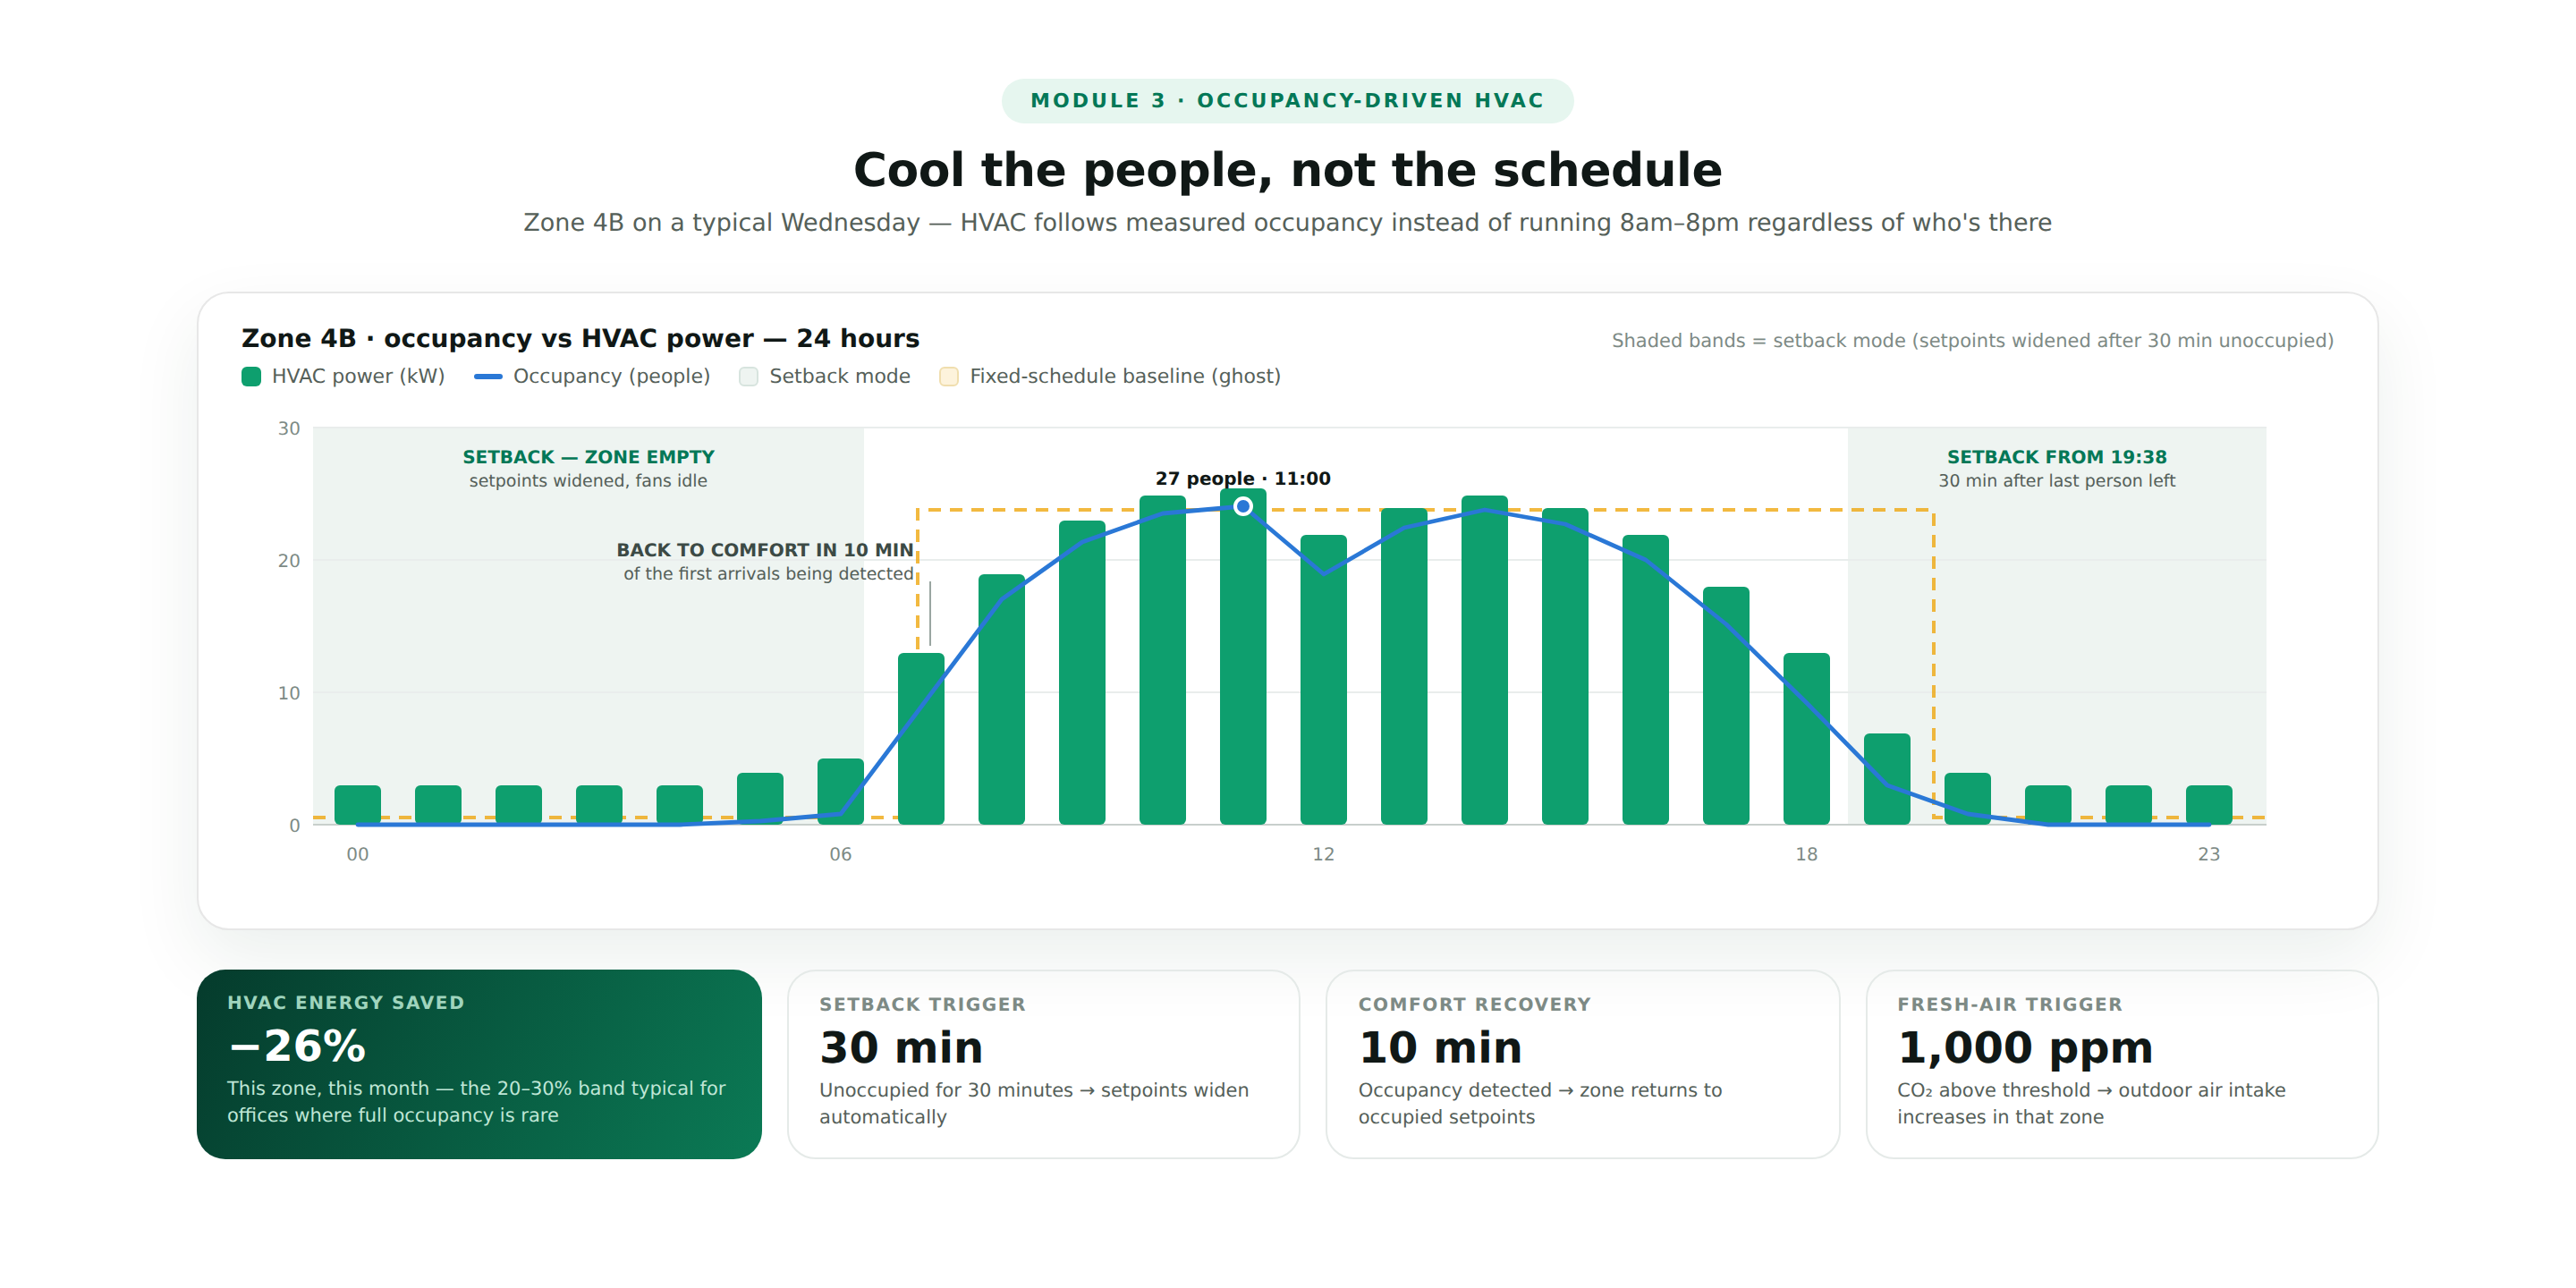
Traditional HVAC operates on fixed schedules, the building is cooled from 8am to 8pm regardless of whether anyone is in the building. Occupancy-driven HVAC uses occupancy sensor data to dynamically adjust:
When a zone is unoccupied for 30 minutes, the HVAC setpoint adjusts to a wider temperature range (setback mode). When occupancy is detected, the zone returns to occupied setpoints within 10 minutes.
This single optimisation typically reduces HVAC energy consumption by 20 to 30% in large commercial offices where full occupancy is rare.
Air quality monitoring:
| Sensor | Measurement | Action Threshold |
| CO₂ | Parts per million | Above 1,000 ppm, increase fresh air intake |
| PM2.5 | Particulate matter | Above 25 µg/m³, alert + increase filtration |
| TVOC | Total volatile organic compounds | Above 500 ppb, alert + ventilation increase |
| Temperature | °C | Outside set range, HVAC adjustment |
| Humidity | Relative humidity % | Outside 40–60% RH, humidifier/dehumidifier |
The comfort complaint loop:
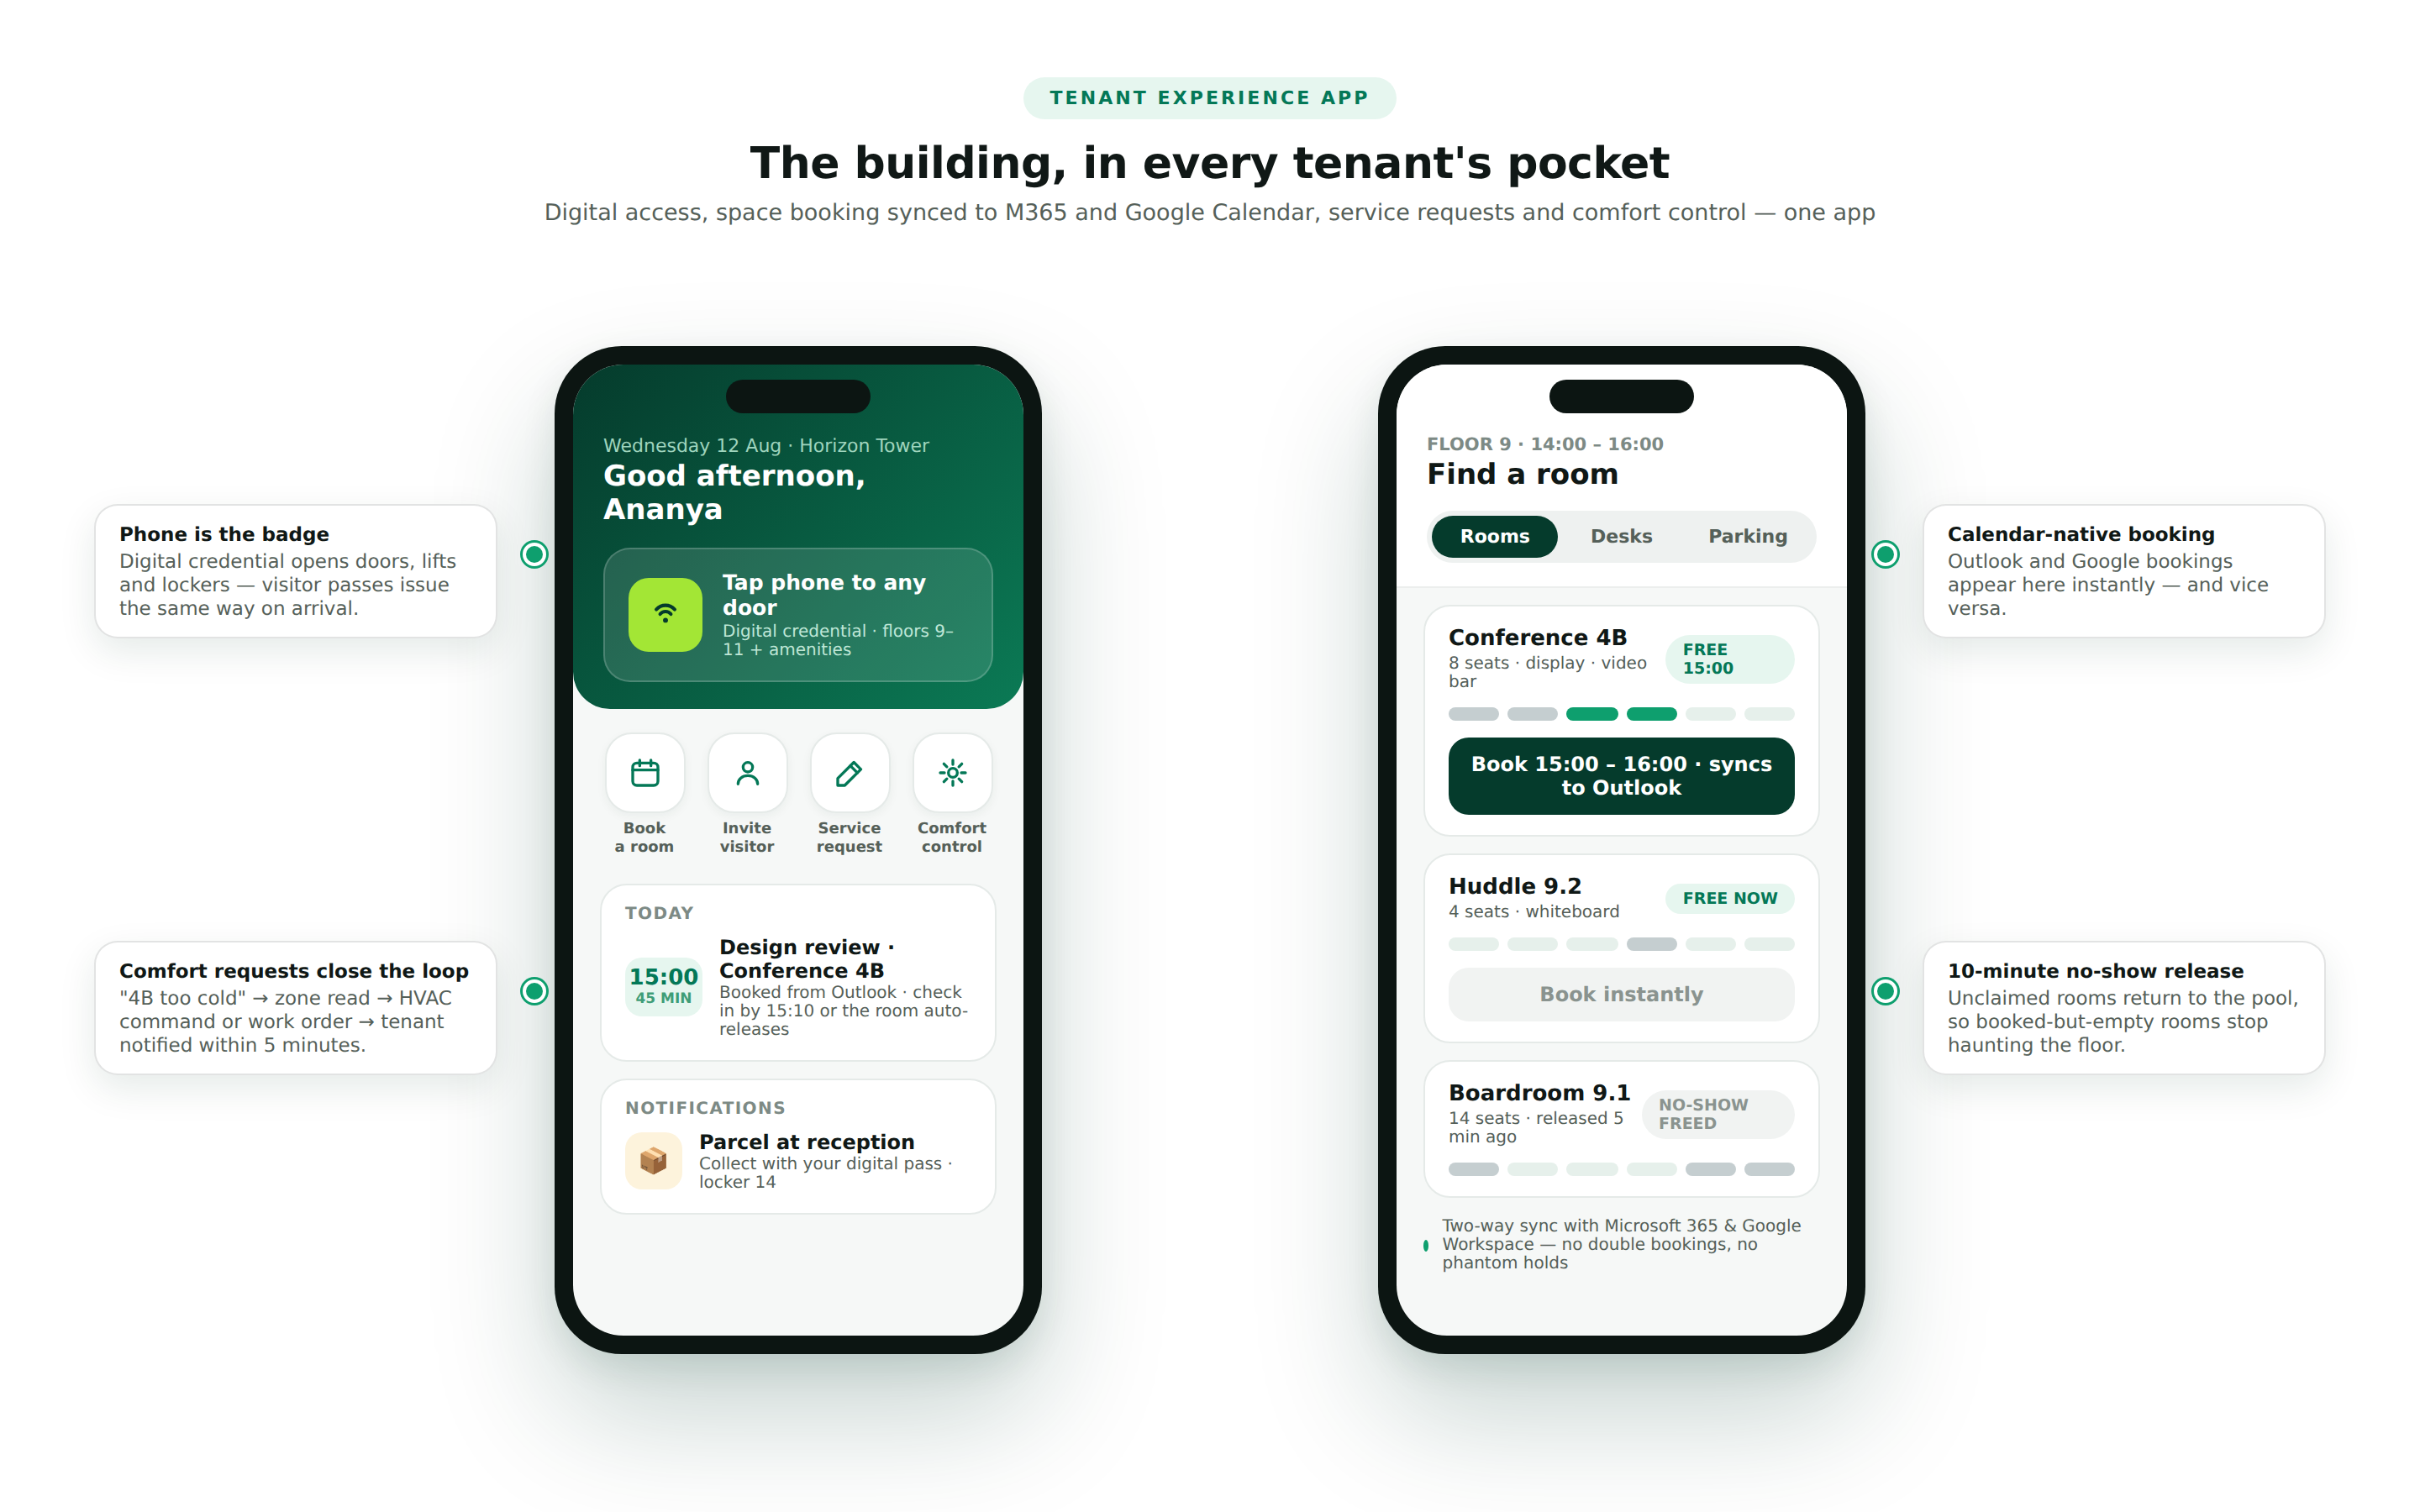
When a tenant submits a comfort complaint, “Conference Room 4B is too cold”, the platform automatically reads the current temperature in that zone, compares it against the setpoint, identifies whether the HVAC is performing as commanded or malfunctioning, and routes either an HVAC adjustment command or a maintenance work order appropriately. The tenant receives a notification within 5 minutes confirming what action was taken.
What tenants need from a building app:
| Feature | Details |
| Space booking | Reserve meeting rooms, hot desks, parking spaces |
| Visitor management | Pre-register visitors, they receive a digital pass on arrival |
| Service requests | Report maintenance issues, request services |
| Comfort controls | Adjust temperature or lighting in personal workspace zones |
| Building services | Cafeteria menu, gym availability, shuttle schedule |
| Parcel collection | Notification when a parcel arrives |
| Building communications | Announcements from building management |
| Access control | Digital access credential, open doors with phone |
| Amenity booking | Book the rooftop terrace, the training room, the podcast studio |
| Feedback | Rate the building experience, report issues |
The space booking engine:
The space booking module integrates with Microsoft 365 and Google Workspace calendars, meeting room bookings made in Outlook or Google Calendar are automatically reflected in the building’s space booking system and vice versa.
No double booking. No phantom reservations for meetings that were cancelled but the room was never released.
Check-in and no-show handling:
Meeting rooms booked but not checked into within 10 minutes of the start time are automatically released, preventing the most frustrating office experience of walking through the building looking for a free meeting room while booked rooms sit empty.
Building equipment that benefits most from predictive maintenance:
| Equipment | Failure Mode | Sensor Signal |
| HVAC chiller | Refrigerant leak, compressor wear | Temperature differential, power draw, vibration |
| AHU (Air Handling Unit) | Belt wear, filter clog, bearing failure | Vibration, airflow, pressure differential, current |
| Cooling tower | Scale buildup, drift, fan failure | Approach temperature, water quality, vibration |
| Elevator | Cable wear, motor degradation, door malfunction | Vibration, ride quality, door cycle count, power |
| Generator | Battery failure, fuel contamination | Battery voltage, fuel quality, run hours |
| Pumps | Bearing wear, cavitation, seal failure | Vibration, flow rate, pressure, current |
The predictive model for HVAC:
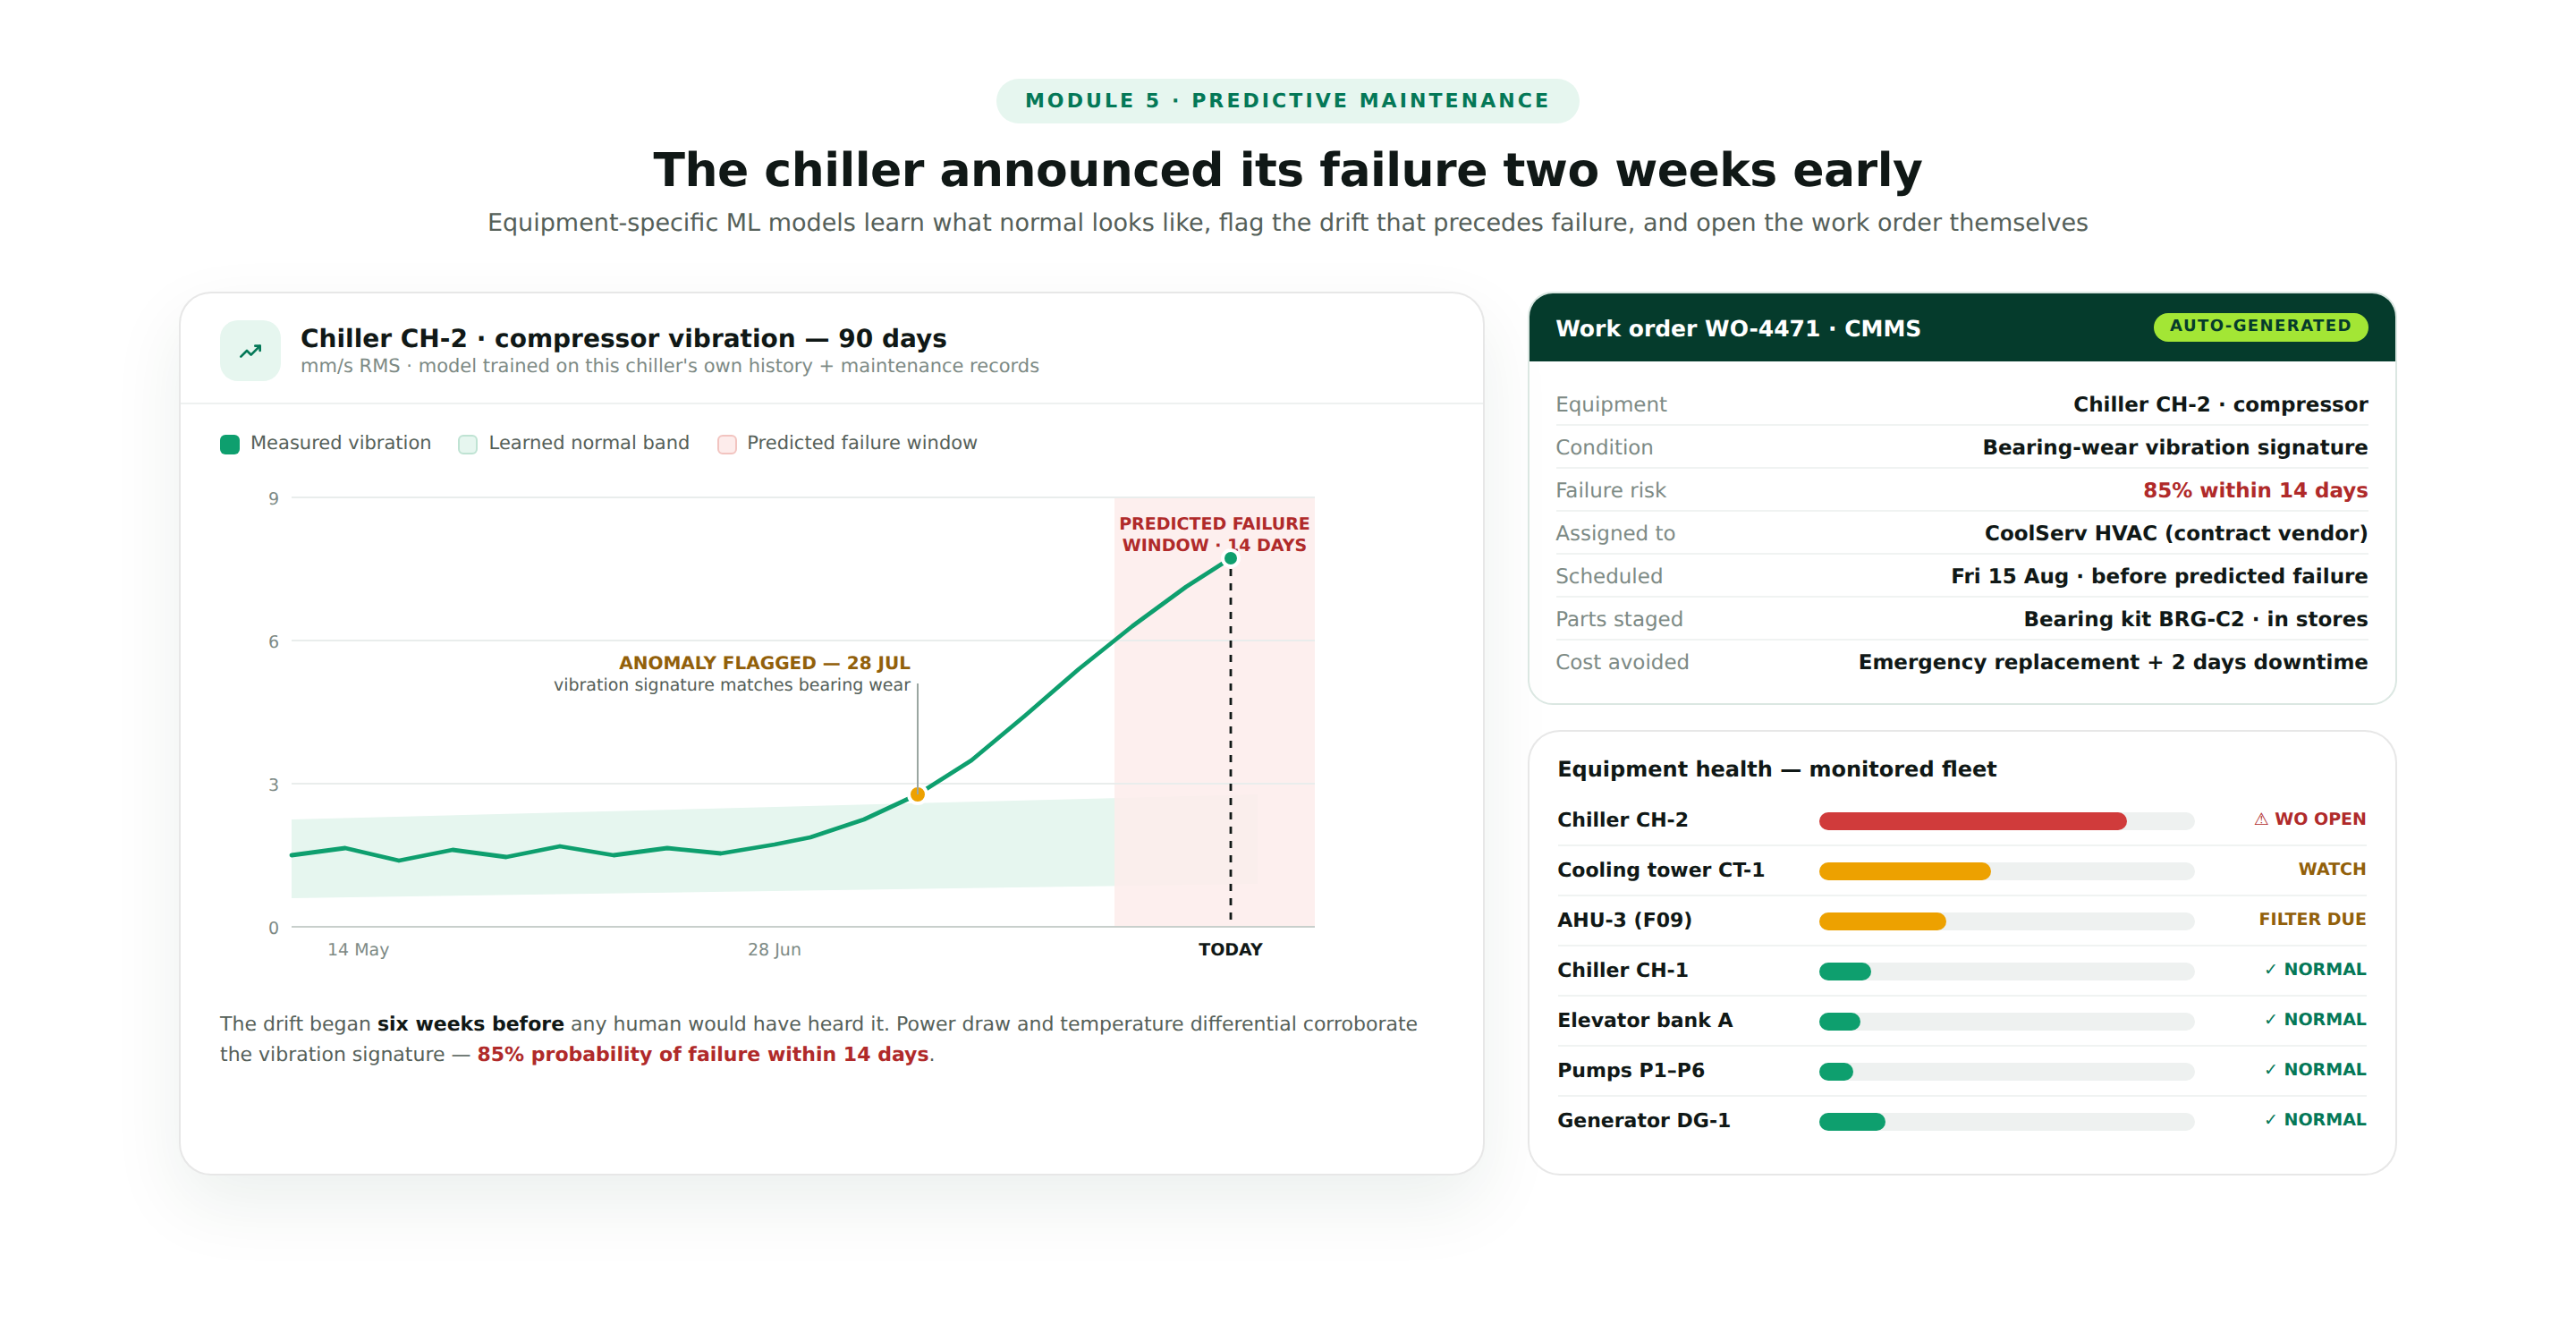
The platform trains equipment-specific ML models, using sensor data from the BMS combined with maintenance history. The model learns what normal looks like for each piece of equipment in its specific installation context, detects anomalies that precede failure, and generates predicted maintenance needs with confidence intervals.
Automated work order generation:
When the predictive model flags an equipment condition, chiller compressor showing vibration signature consistent with bearing wear, 85% probability of failure within 14 days, the platform automatically generates a maintenance work order in the CMMS (Computerised Maintenance Management System), assigns it to the appropriate technician or vendor, and schedules it for completion before the predicted failure date.
The occupancy data sources:
| Source | Granularity | Accuracy |
| Wi-Fi connected device count | Room/zone level | Medium, counts devices not people |
| Infrared occupancy sensors | Room level | High, detects presence |
| Badge/access reader data | Floor entry/exit | High, named individual |
| Camera + computer vision | Desk or zone level | Very high, but privacy concerns |
| Meeting room booking + check-in | Room level | High for booked spaces |
| CO₂ sensors | Zone level | Medium, proxy for occupancy |
The space utilisation dashboard:
| View | Business Question |
| Peak occupancy by floor | Which floors and zones are most used during peak hours? |
| Average utilisation by room type | Are meeting rooms used efficiently? Are desks underutilised? |
| Time-of-day occupancy pattern | When is the building actually full vs empty? |
| Desk utilisation by team | Which teams need more desk space vs which have excess? |
| Space efficiency ratio | Revenue per square metre of occupied space |
| Ghost meeting rooms | Rooms booked but consistently not used |
The portfolio optimisation output:
For a corporate real estate manager with 500,000 square feet across 3 offices, the space utilisation analytics answer: can we reduce our total footprint by 20% without impacting employee experience?
Which locations are consistently underutilised and can be downsized? Which floor configurations waste space on corridors and support functions that could be redesigned as flexible working space?
| Module | Cost Range (USD) | Notes |
| BMS integration (BACnet, Modbus, MQTT) | $10K – $20K | Protocol adapters + gateway |
| IoT device registry + health monitoring | $6K – $12K | |
| Energy sub-metering + real-time dashboard | $8K – $15K | |
| Peak demand management + demand response | $6K – $12K | |
| ESG reporting (LEED, GHG Protocol) | $5K – $10K | |
| HVAC occupancy-driven control | $8K – $15K | Sensor integration + control commands |
| Air quality monitoring + alerts | $5K – $10K | |
| Tenant experience app (iOS app + Android app) | $10K – $18K | |
| Space booking + M365/Google calendar integration | $6K – $12K | |
| Visitor management | $5K – $10K | |
| Predictive maintenance ML model | $8K – $15K | Per equipment class |
| CMMS integration (work order) | $5K – $10K | |
| Space utilisation analytics | $6K – $12K | Multi-source occupancy data |
| Security + access control integration | $5K – $10K | |
| AWS IoT + VAPT + Year 1 ops | $6K – $12K | |
| Total | $99K – $193K | Full smart building platform |
EngineerBabu built IoT monitoring infrastructure for Somnoware/ResMed and enterprise operations for Adani Group. CMMI Level 5. Google AI Accelerator 2024 Top 20. Contact: mayank@engineerbabu.com
BACnet (Building Automation and Control Networks) is the ANSI/ASHRAE standard communication protocol for building automation systems. It defines how devices, HVAC controllers, lighting systems, fire panels, access control, energy meters, communicate with each other and with supervisory systems over standard network infrastructure. BACnet is important for smart building integration because it is the only truly open, vendor-neutral standard in building automation, a BACnet-compliant HVAC controller from Carrier can communicate with a BACnet-compliant supervisory platform from any vendor without proprietary middleware. Most major commercial building equipment manufactured after 2005 supports BACnet at some level. A smart building platform that implements BACnet communication can connect to 80 to 90% of existing building systems without requiring system replacements, making it the foundation of any building integration architecture.
Energy Use Intensity (EUI) is the annual energy consumption of a building divided by its gross floor area, expressed as kWh per square metre per year or kBtu per square foot per year. EUI is the primary benchmark for comparing building energy performance across properties, because it normalises for size. A well-designed commercial office building in a tropical climate targets EUI below 150 kWh/m²/year. A poorly managed building of the same type might have EUI above 250 kWh/m²/year. A smart building platform improves EUI through three mechanisms: occupancy-driven HVAC and lighting that eliminates energy consumption in unoccupied zones, peak demand management that reduces demand charges and smooths consumption, and anomaly detection that identifies equipment running outside optimal parameters, a chiller running 15% less efficiently than its specification is flagged for maintenance before the inefficiency compounds. These three interventions combined typically reduce EUI by 20 to 35% within the first year.
Tenant experience is increasingly a differentiating factor in commercial real estate leasing decisions, particularly in a market where hybrid work has reduced average office occupancy and tenants have more negotiating power. Research by JLL and CBRE consistently shows that buildings with high-quality digital tenant experience platforms have 12 to 18 percentage point higher lease renewal rates and command 3 to 7% rental premiums. The mechanisms are practical: a tenant whose maintenance reques t is resolved in 4 hours instead of 3 days, whose team can find and book a meeting room in 30 seconds instead of making a phone call, and who receives proactive communication about building events rather than paper notices in the elevator lobby, has a materially better daily experience. This daily experience accumulates into brand perception of the building, when the lease renewal comes up, a tenant who has had a consistently positive building experience is significantly more likely to renew than one who associates the building with friction and unresolved issues.