How to Build a Real Estate Investment Platform, Deal Sourcing, Underwriting, Portfolio Analytics, and Investor Portal 2026


Create engaging, high-performance mobile applications tailored to your business needs. We craft future-ready apps that offer smooth user experiences on all devices.
Build robust and scalable websites and CMS platforms that help you manage content effortlessly. Our development ensures a seamless digital presence.
Launch secure, feature-rich online stores with intuitive shopping experiences. We build tailored eCommerce platforms designed for growth.
Design captivating games with immersive gameplay and stunning graphics. From concept to launch, we build engaging experiences that players love.
Enhance your customer relationships with customized Salesforce implementations. Drive growth and efficiency with smarter CRM solutions.
Harness artificial intelligence and machine learning to automate workflows and gain actionable insights. Our AI transforms data into smart decisions.
Accelerate your software delivery lifecycle with continuous integration, delivery, and infrastructure automation to boost efficiency.
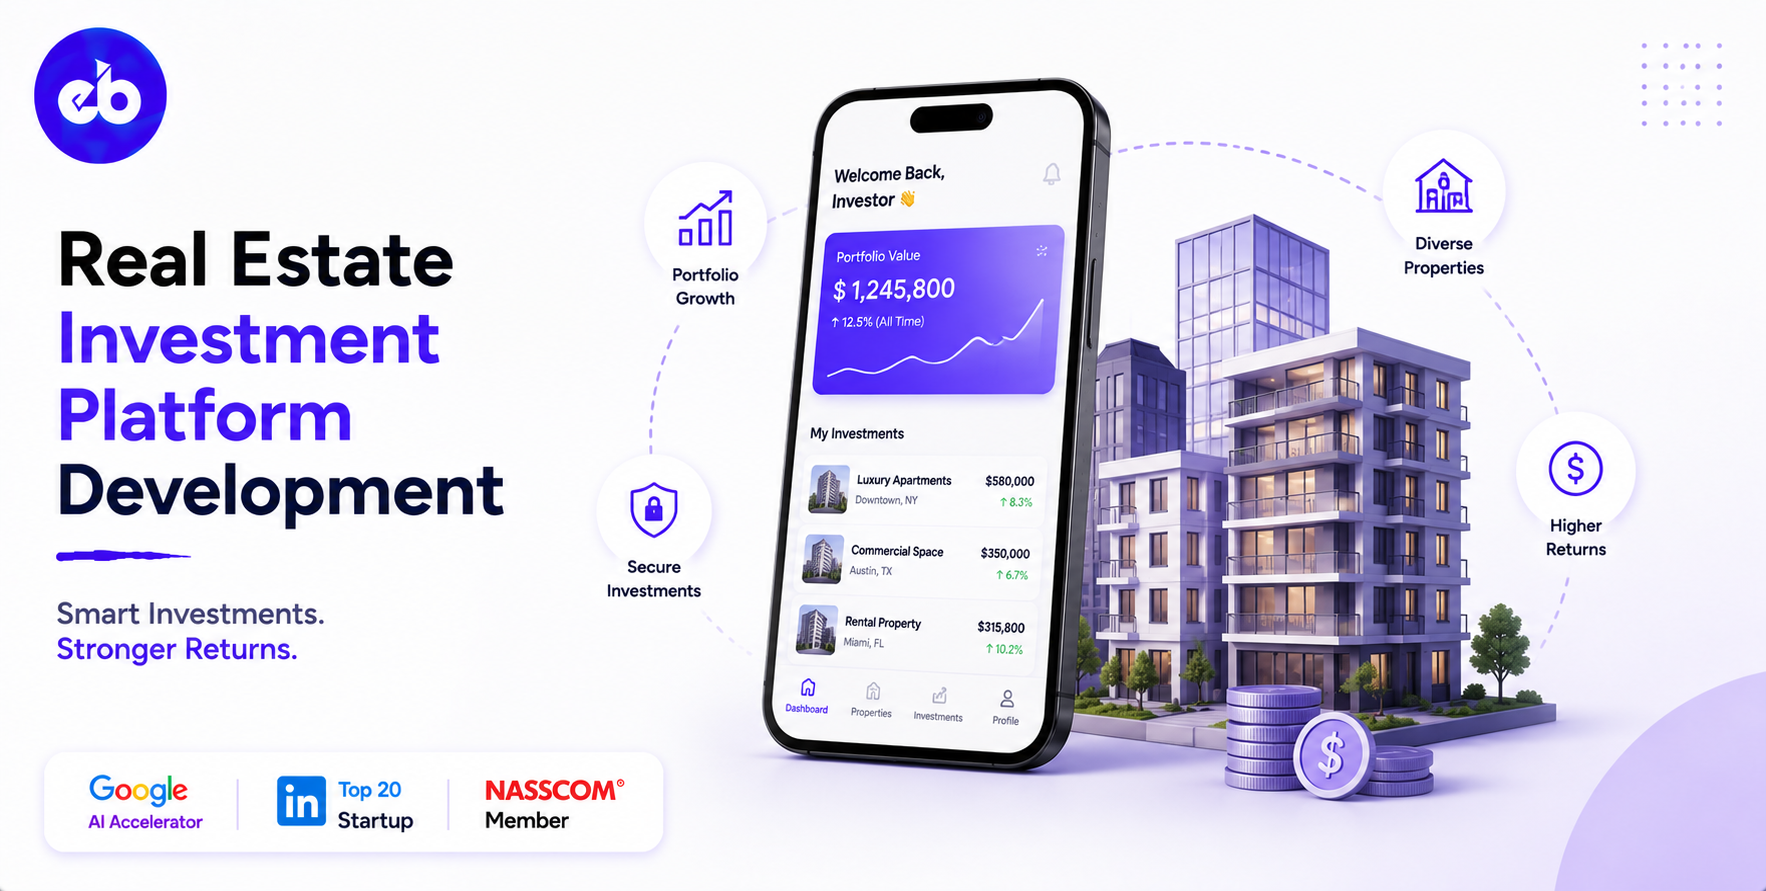
The US commercial real estate investment market transacted $600 billion in 2025. The firms that are winning in this market are the ones that can source better deals, underwrite them faster, and manage their portfolio with the analytical precision that institutional capital now demands.
A spreadsheet-based underwriting process that takes two weeks cannot compete with a platform-enabled process that takes two days and surfaces 200 additional data points the analyst never had before.
On the investment management side, real estate GPs managing $100M to $5B in AUM are increasingly expected by LPs to provide transparency, not just quarterly reports, but live access to portfolio performance, individual asset dashboards, and the data to independently verify what they are being told.
This guide covers how to build a real estate investment platform, from deal sourcing and automated underwriting through LP reporting, portfolio analytics, and the investor portal that keeps institutional LPs engaged and renewing.
EngineerBabu has built financial platforms for 75+ YC-backed companies and real estate technology for multiple property developers. CMMI Level 5. Google AI Accelerator 2024 Top 20. Contact: mayank@engineerbabu.com
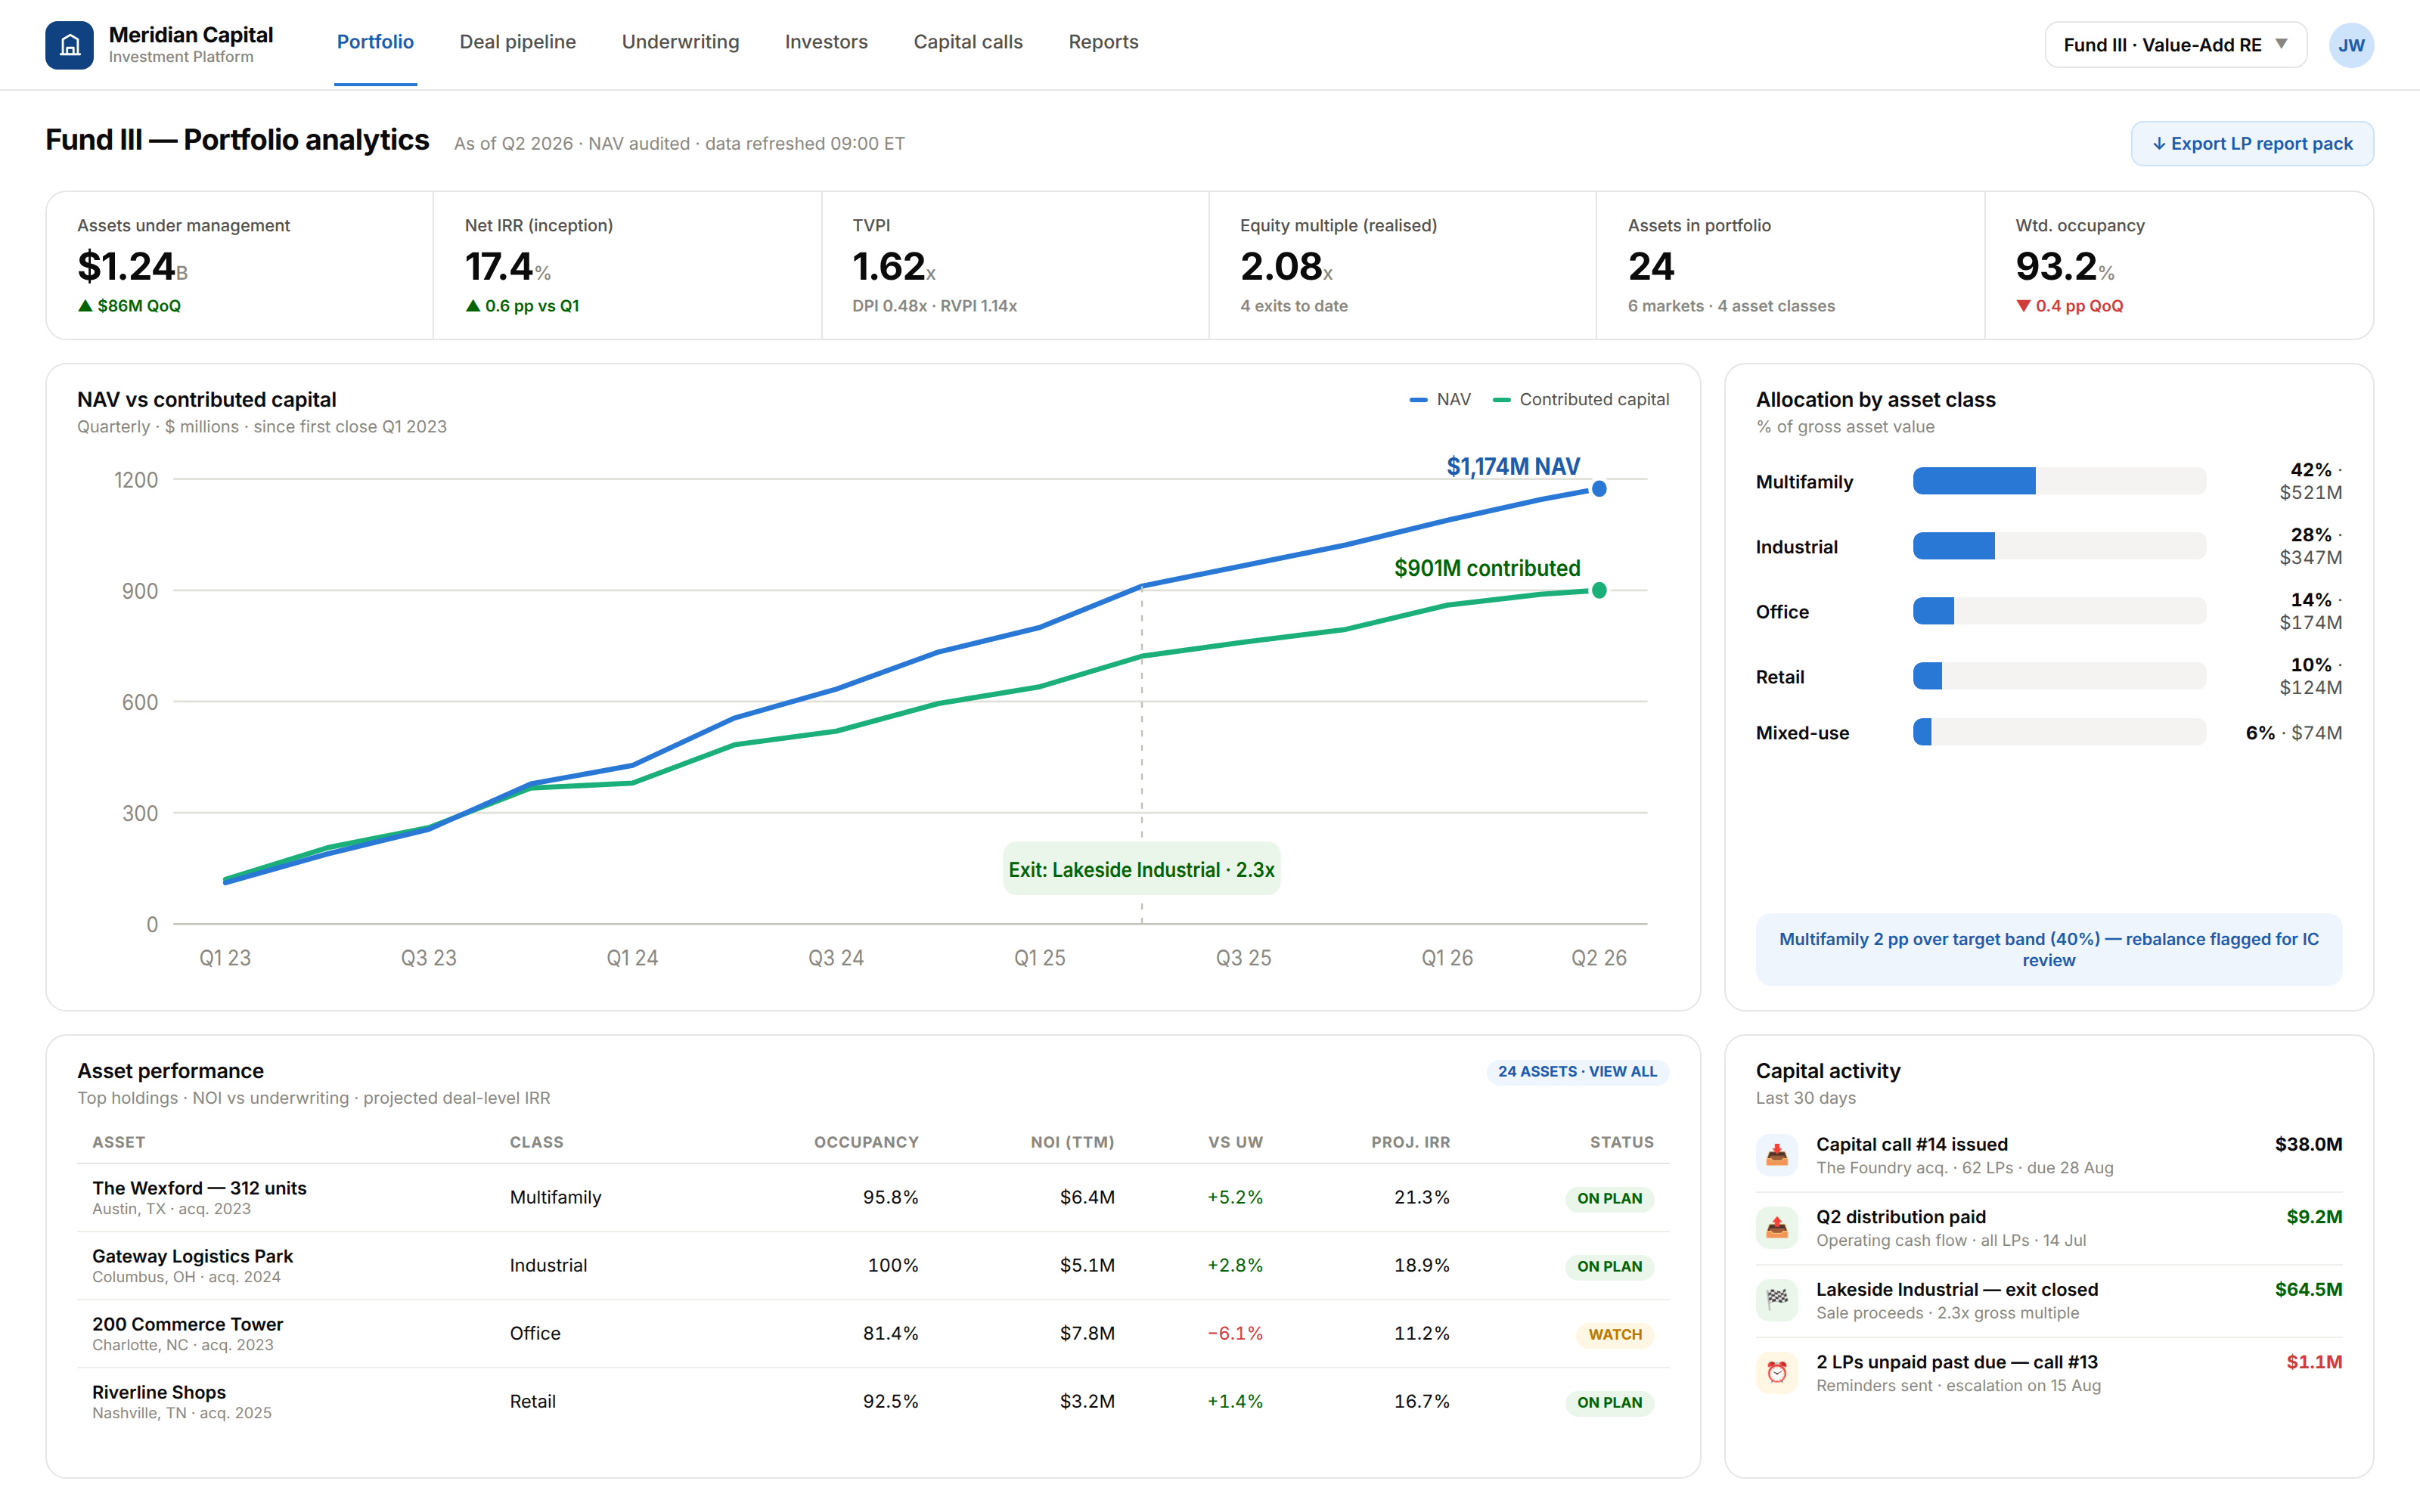
| Function | Module |
| Deal pipeline management | Sourcing, screening, due diligence tracking |
| Automated underwriting | Financial model, comparable analysis, sensitivity |
| Market data integration | CoStar, CBRE, Zillow API for comps and market data |
| Investment committee workflow | Memo generation, approval workflow, vote tracking |
| Capital stack management | Equity, debt, preferred, waterfall modelling |
| Asset management | Operating metrics, lease tracking, NOI monitoring |
| Portfolio analytics | IRR, equity multiple, TVPI across the portfolio |
| LP/investor management | Investor profiles, commitments, capital calls |
| Investor portal | Self-service dashboard, distributions, documents |
| Reporting | Quarterly reports, K-1s, audit-ready records |
| Compliance | Reg D, Reg A+, AML/KYC for investor onboarding |
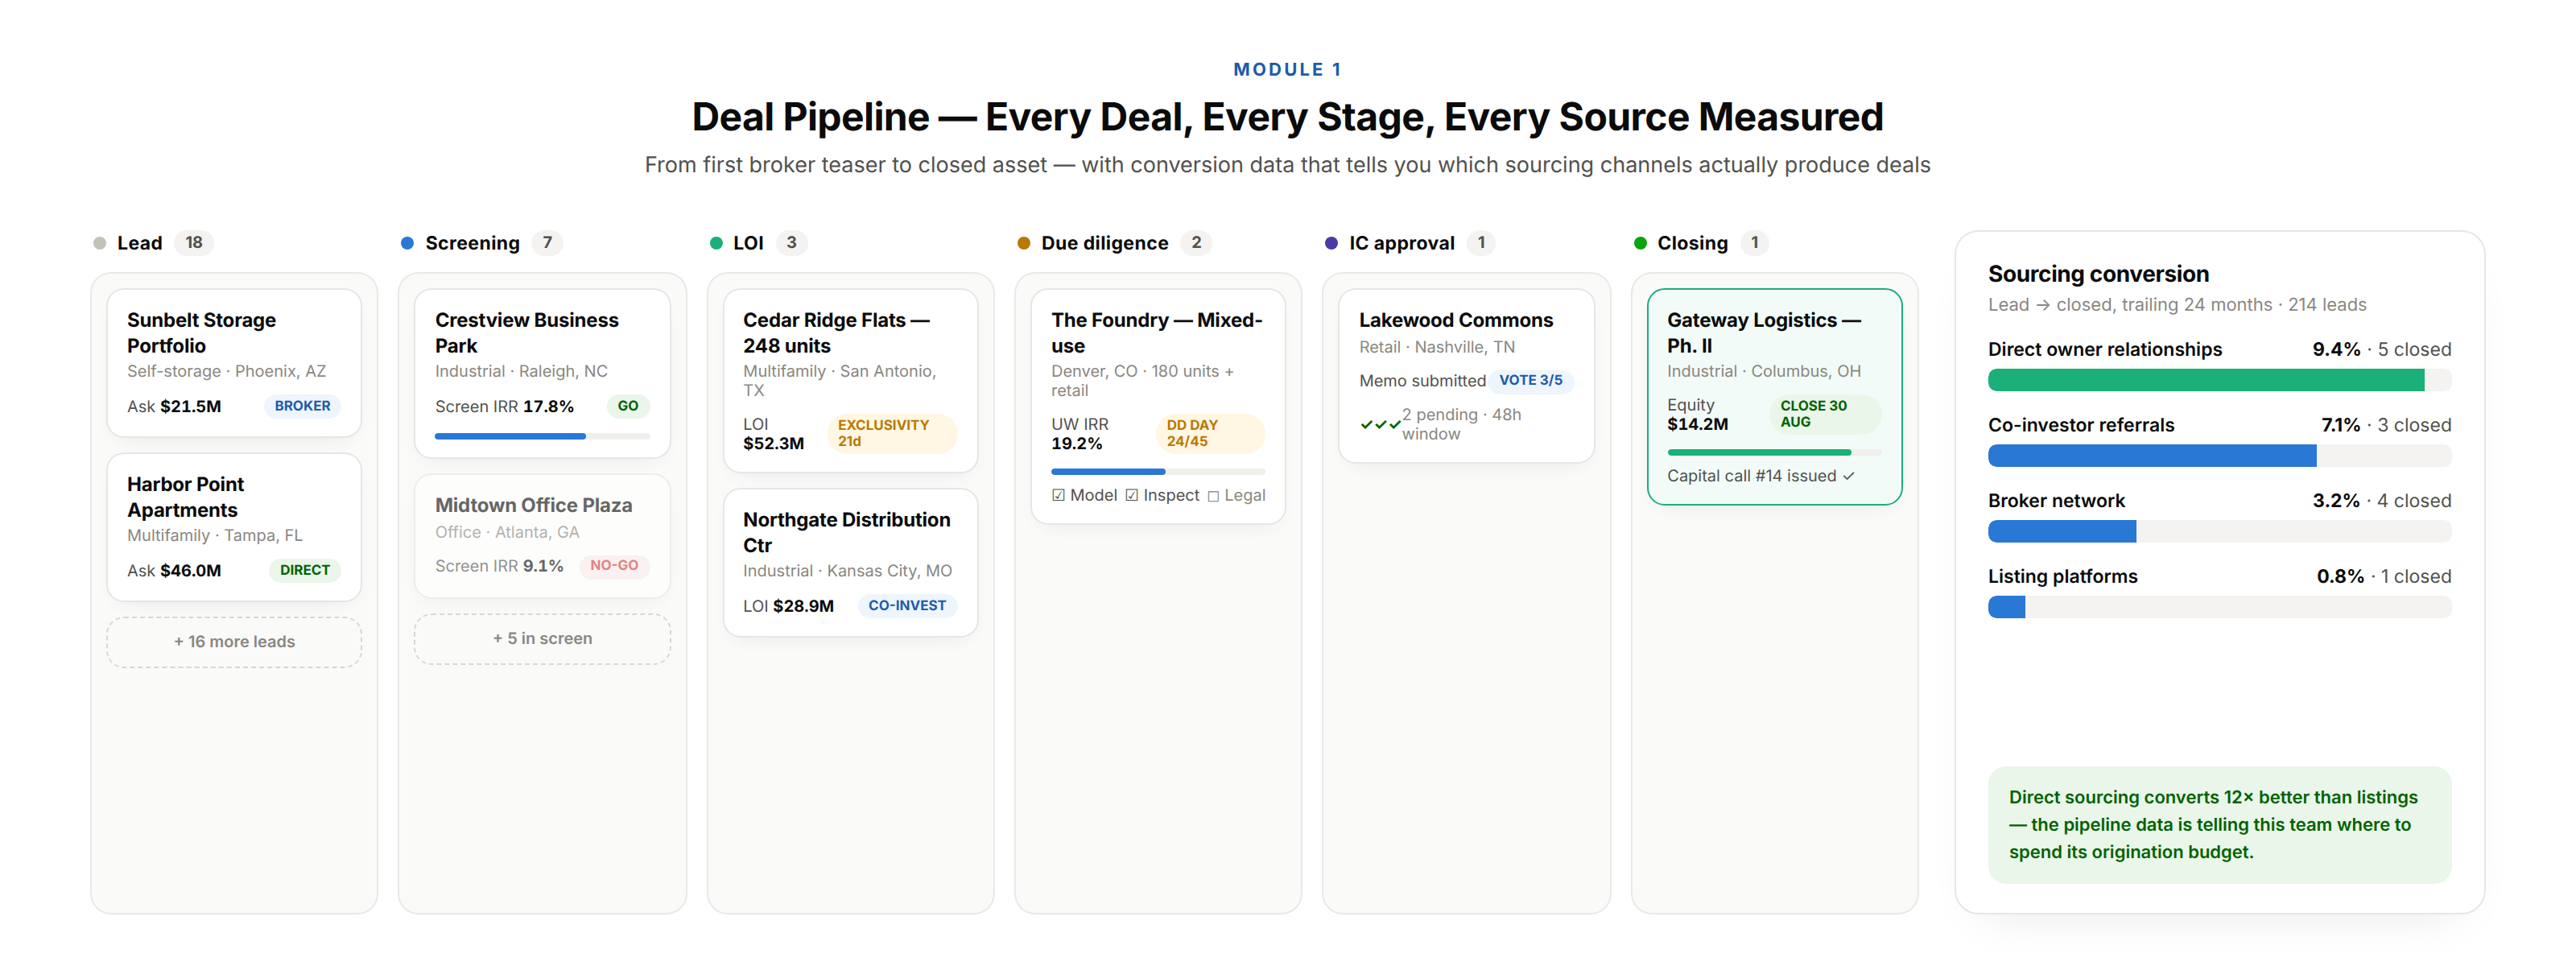
The deal pipeline stages:
| Stage | Definition | Key Actions |
| Lead | Property identified, initial screening not started | Basic info captured, address, asset type, asking price |
| Screening | Initial financial screen, does it meet investment criteria? | 1-page screening model, go/no-go decision |
| LOI | Letter of intent submitted | LOI terms, exclusivity period |
| Due diligence | Full underwriting in progress | Financial model, physical inspection, legal review |
| IC approval | Investment committee review | IC memo submitted, voting |
| Closing | Transaction in progress | Legal closing, capital deployment |
| Asset | Investment closed, in portfolio | Switches to asset management module |
| Passed | Decided not to proceed | Reason logged, remains in pipeline for future reference |
The deal sourcing network:
Deals come from multiple sources, brokers, direct owner relationships, co-investor referrals, online listing platforms (CoStar, LoopNet). The platform tracks the source of every deal and measures which sources produce the highest conversion rate from lead to closed investment.
Over time, this data tells the investment team which sourcing channels to invest in and which to deprioritise.
The financial model structure:
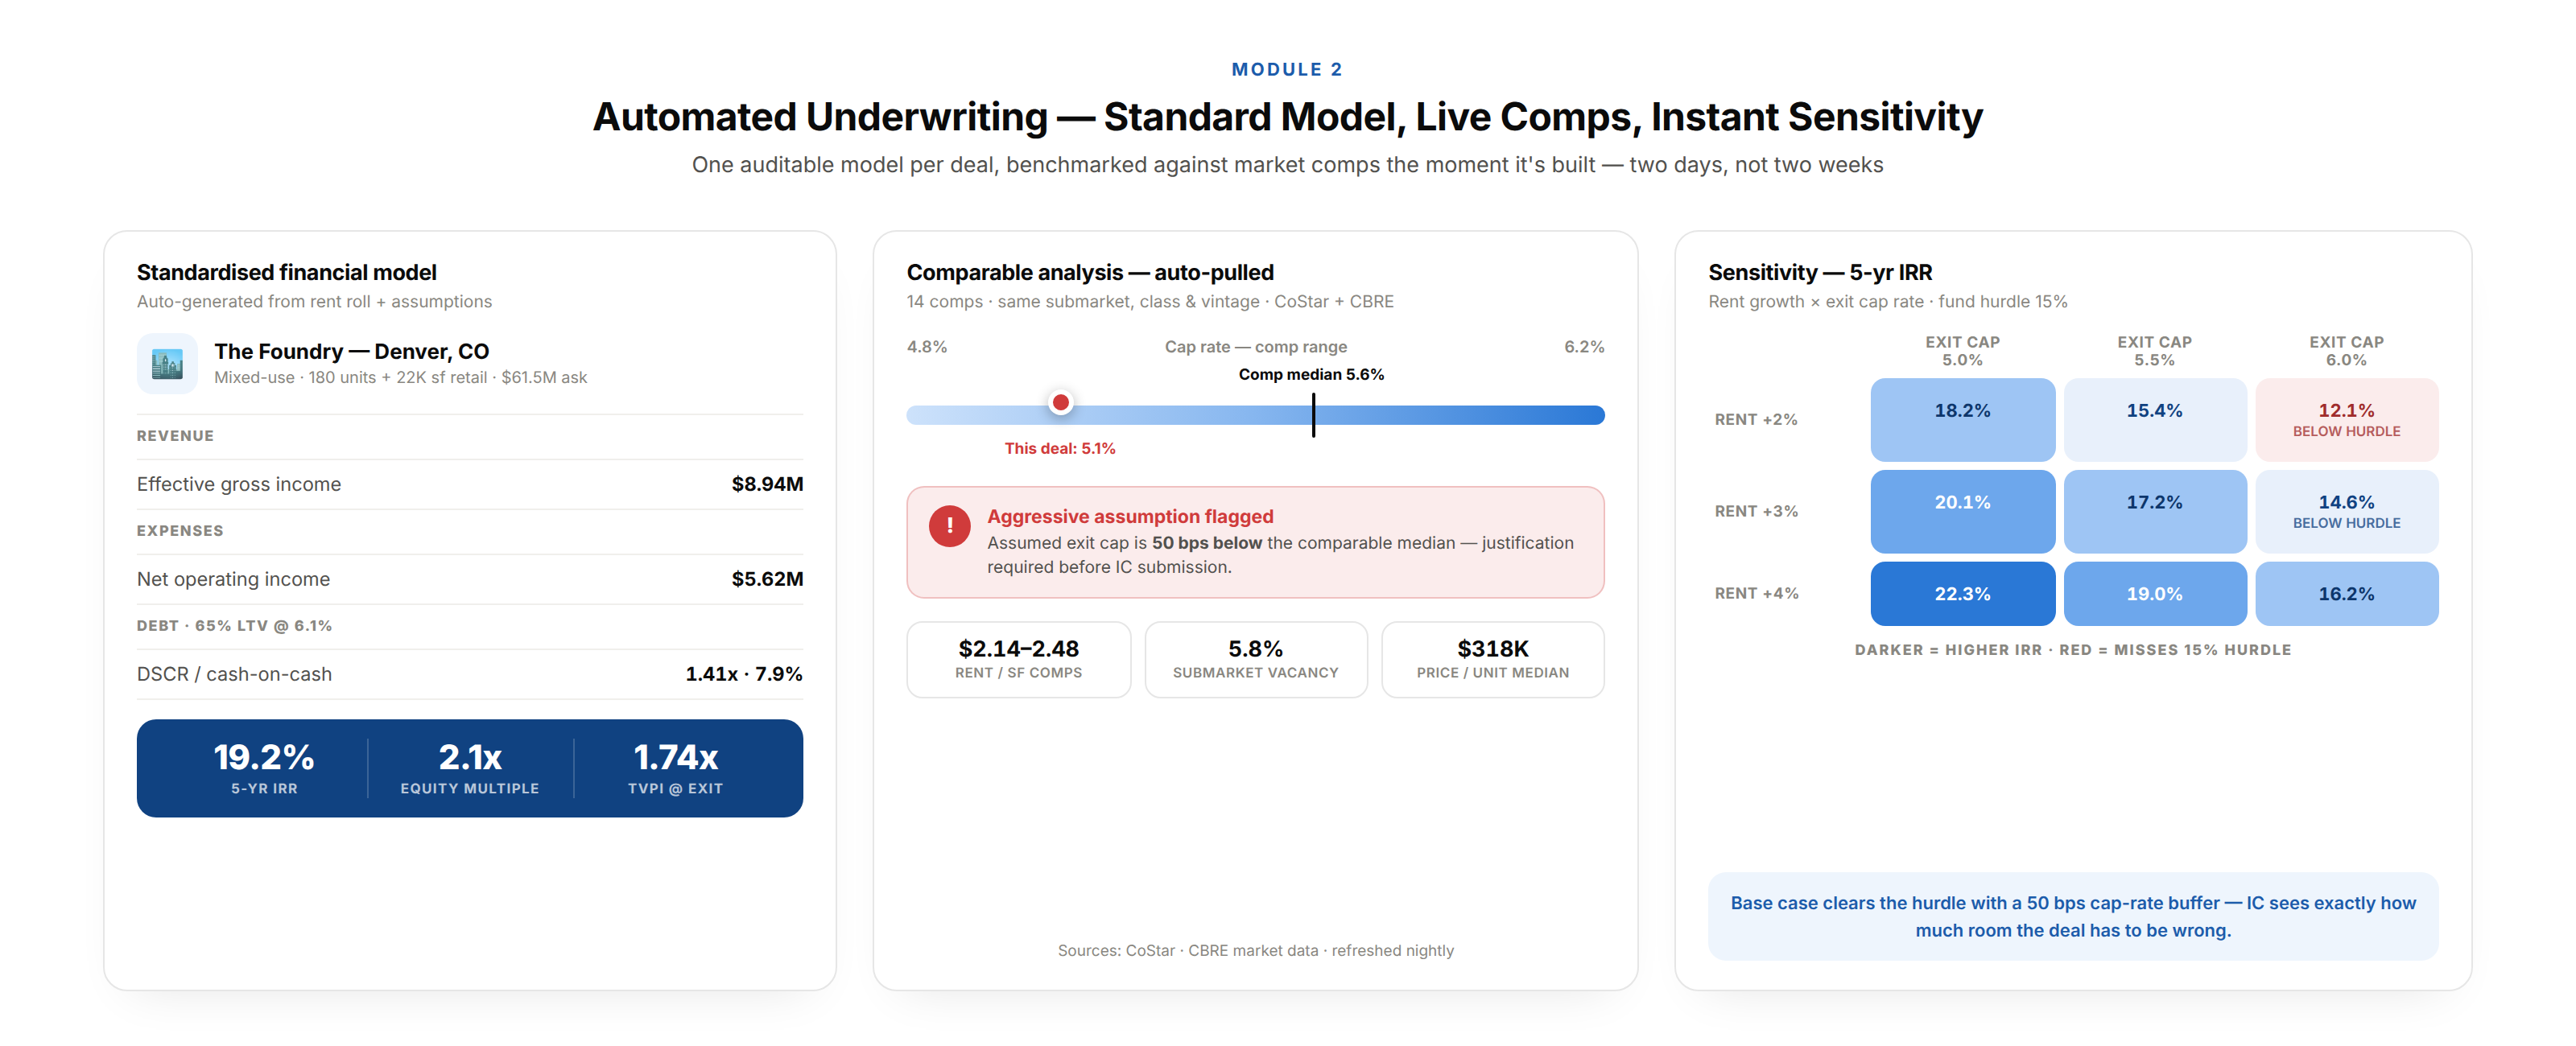
Every deal in the platform generates a standardised financial model, not a custom spreadsheet per deal, but a consistent model that can be compared across deals and audited by the investment committee.
| Model Section | Inputs | Outputs |
| Revenue | Current rent roll, market rent, occupancy assumption, rent growth | Gross potential income, effective gross income |
| Expenses | OpEx by category, management fee, CapEx reserve | Total operating expenses, NOI |
| Debt service | Loan amount, interest rate, amortisation, LTV | Annual debt service, DSCR |
| Cash flow | NOI − Debt service | Net cash flow, cash-on-cash return |
| Exit | Exit cap rate, hold period, selling costs | Sale proceeds, equity return |
| Returns | All cash flows from acquisition to exit | IRR, equity multiple, TVPI |
The automated comparable analysis:
The platform integrates with CoStar, CBRE market data, or regional commercial data providers to pull comparable transactions, similar properties in the same market, same asset class, similar vintage. The comp analysis shows:
Cap rate range from recent comparable sales. Rent per square foot range from comparable leases. Vacancy rate for the submarket. Asking price per unit or per square foot for comparable listings.
The underwriting model automatically flags if the deal’s assumed cap rate is more than 50 basis points below the comparable median, a potential aggressive assumption requiring justification.
The sensitivity analysis:
For every deal, the platform generates a sensitivity table showing how returns change across key assumption ranges:
| Exit Cap Rate | ||
| Rent Growth | 5.0% | 5.5% |
| 2% | 18.2% IRR | 15.4% IRR |
| 3% | 20.1% IRR | 17.2% IRR |
| 4% | 22.3% IRR | 19.0% IRR |
The investment committee uses this table to understand what assumptions need to hold for the deal to meet the fund’s return hurdle, and how much buffer exists if assumptions are wrong.
The IC memo generation:
When a deal clears due diligence and is ready for investment committee review, the platform generates an IC memo automatically from the deal data, pulling the financial model outputs, the comparable analysis, the physical due diligence summary, the legal due diligence highlights, and the risk factors identified during underwriting.
The analyst reviews and edits the AI-generated draft, then submits for IC review.
The IC voting workflow:
| Step | Action |
| Memo submitted | IC members receive notification, memo available for review |
| Review period | Defined period (typically 48–72 hours) for member review |
| IC meeting | Live or virtual discussion, meeting notes recorded |
| Vote | Platform records each member’s vote, approve, approve with conditions, decline |
| Decision communicated | Decision and rationale recorded and communicated to the deal team |
| Next steps | If approved, closing workflow initiated; if declined, deal moved to Passed |
The capital stack model:
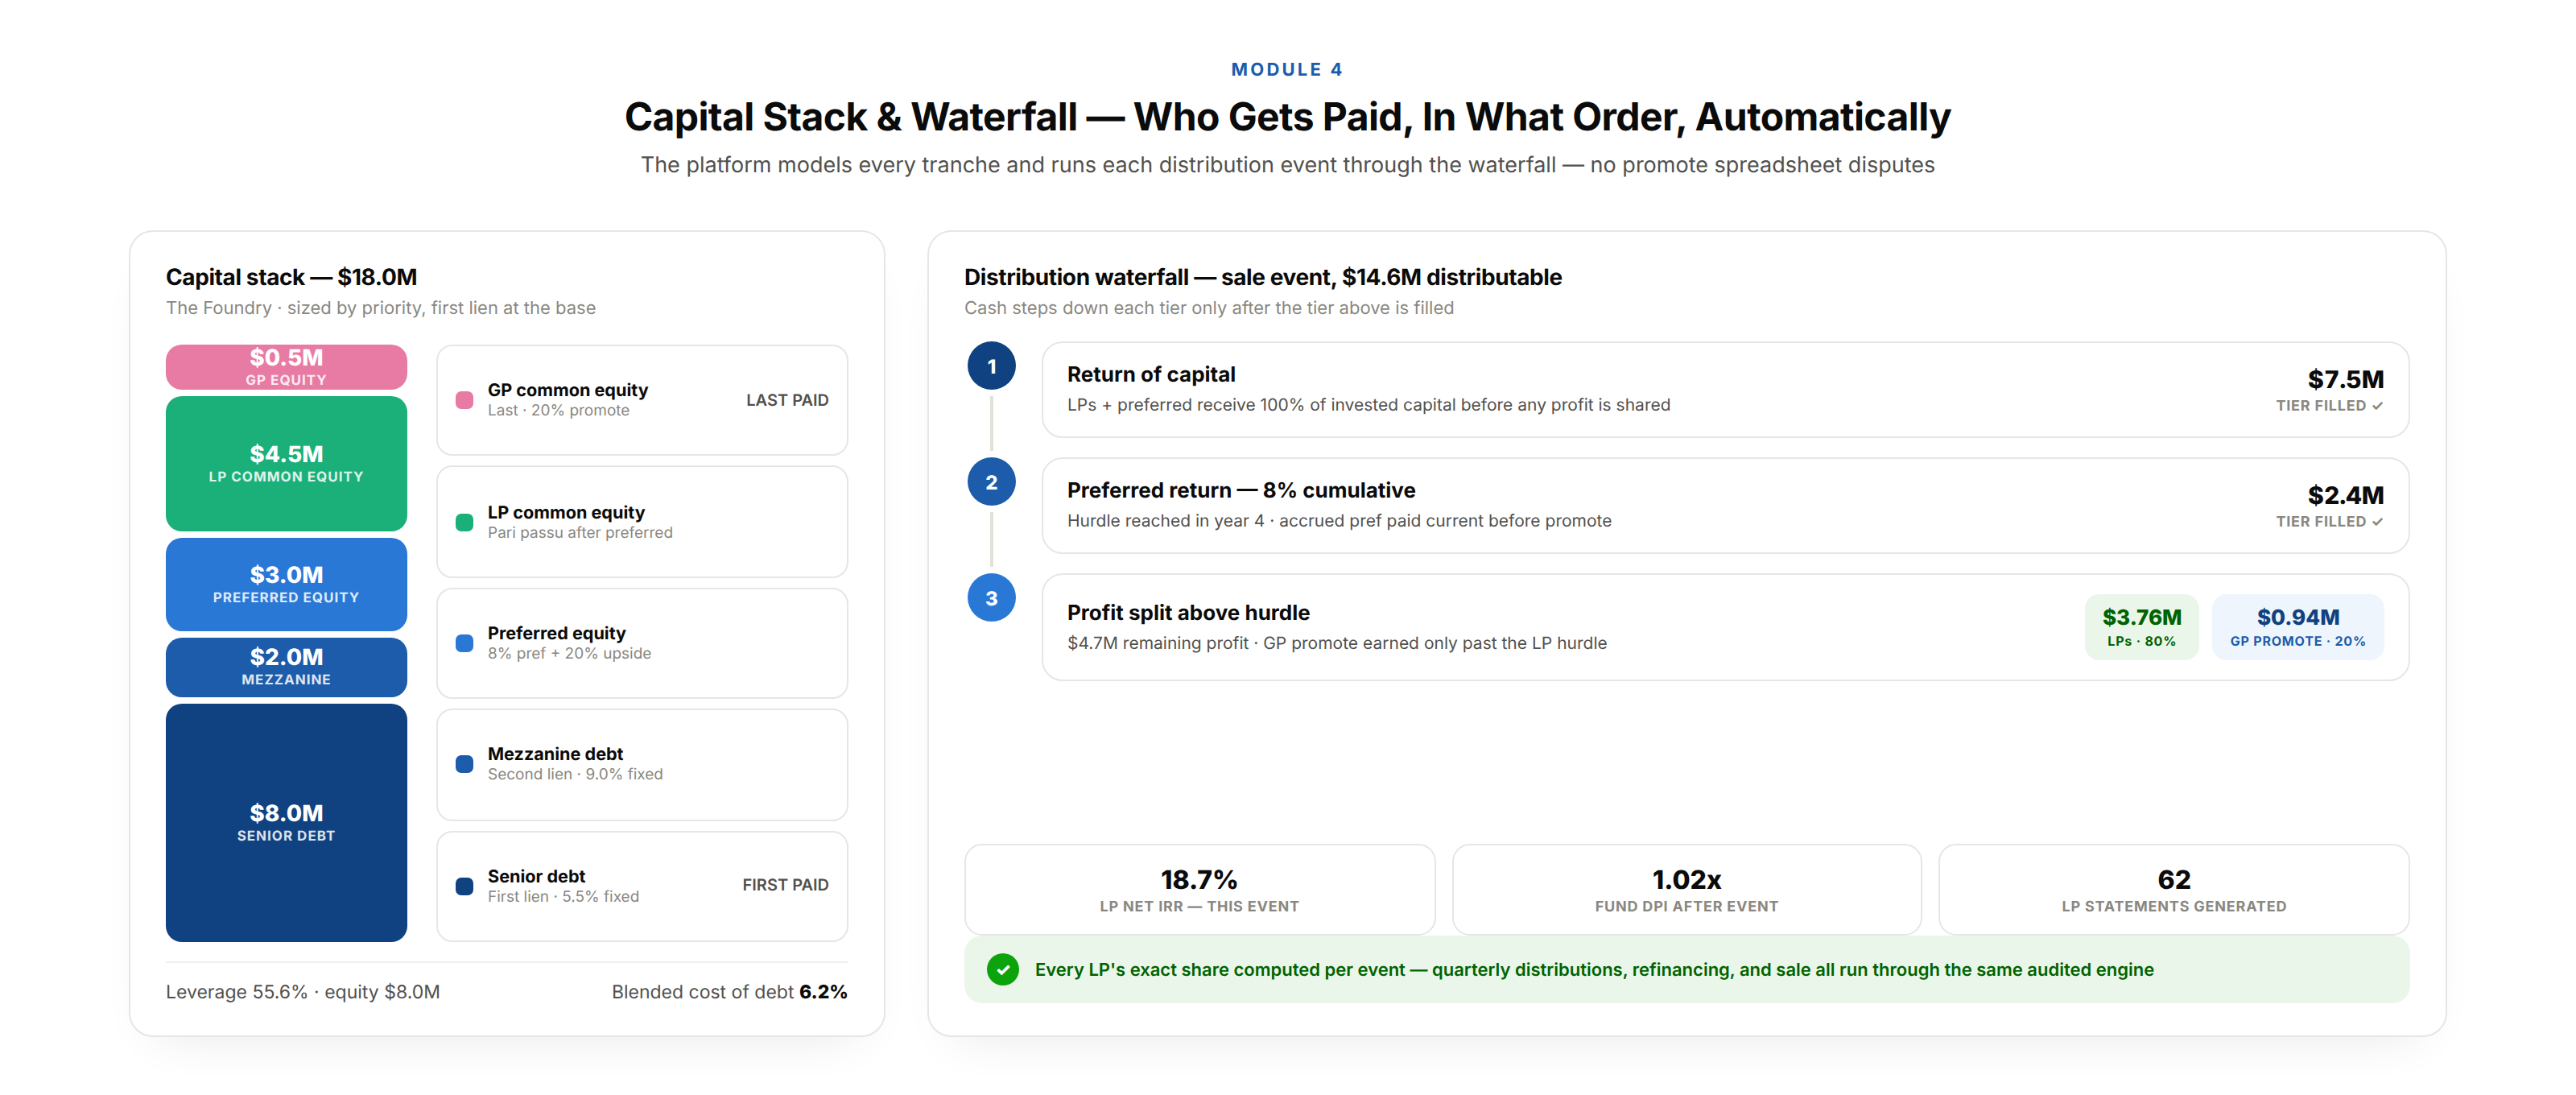
Every investment has a capital structure, how the investment is financed:
| Tranche | Amount | Priority | Return |
| Senior debt | $8,000,000 | First lien | 5.5% fixed |
| Mezzanine debt | $2,000,000 | Second lien | 9.0% fixed |
| Preferred equity | $3,000,000 | Preferred return | 8% preferred + 20% upside |
| Common equity, GP | $500,000 | Last | 20% promote |
| Common equity, LP | $4,500,000 | Last (before promote) | Pari passu after preferred |
The waterfall calculation:
The waterfall distributes cash flows from operations and sale proceeds in the defined priority order. The platform calculates:
Who gets paid first and how much at each distribution event. When the preferred return hurdle is reached. How the promote (GP carry) is calculated, typically after LPs achieve a minimum return hurdle. What each investor receives at each capital event, quarterly distribution, refinancing, and sale.
LP profile:
| Field | Details |
| Investor type | Individual, family office, institution, fund of funds |
| Accreditation | Accredited investor verification (Form D requirements) |
| KYC/AML | Identity verification, beneficial ownership, OFAC screening |
| Investment history | All funds invested in, commitment amounts, distributions received |
| Capital accounts | Current capital account balance per investment |
| Tax documentation | K-1 delivery history |
| Communication preferences | Reporting frequency, format |
Capital call management:
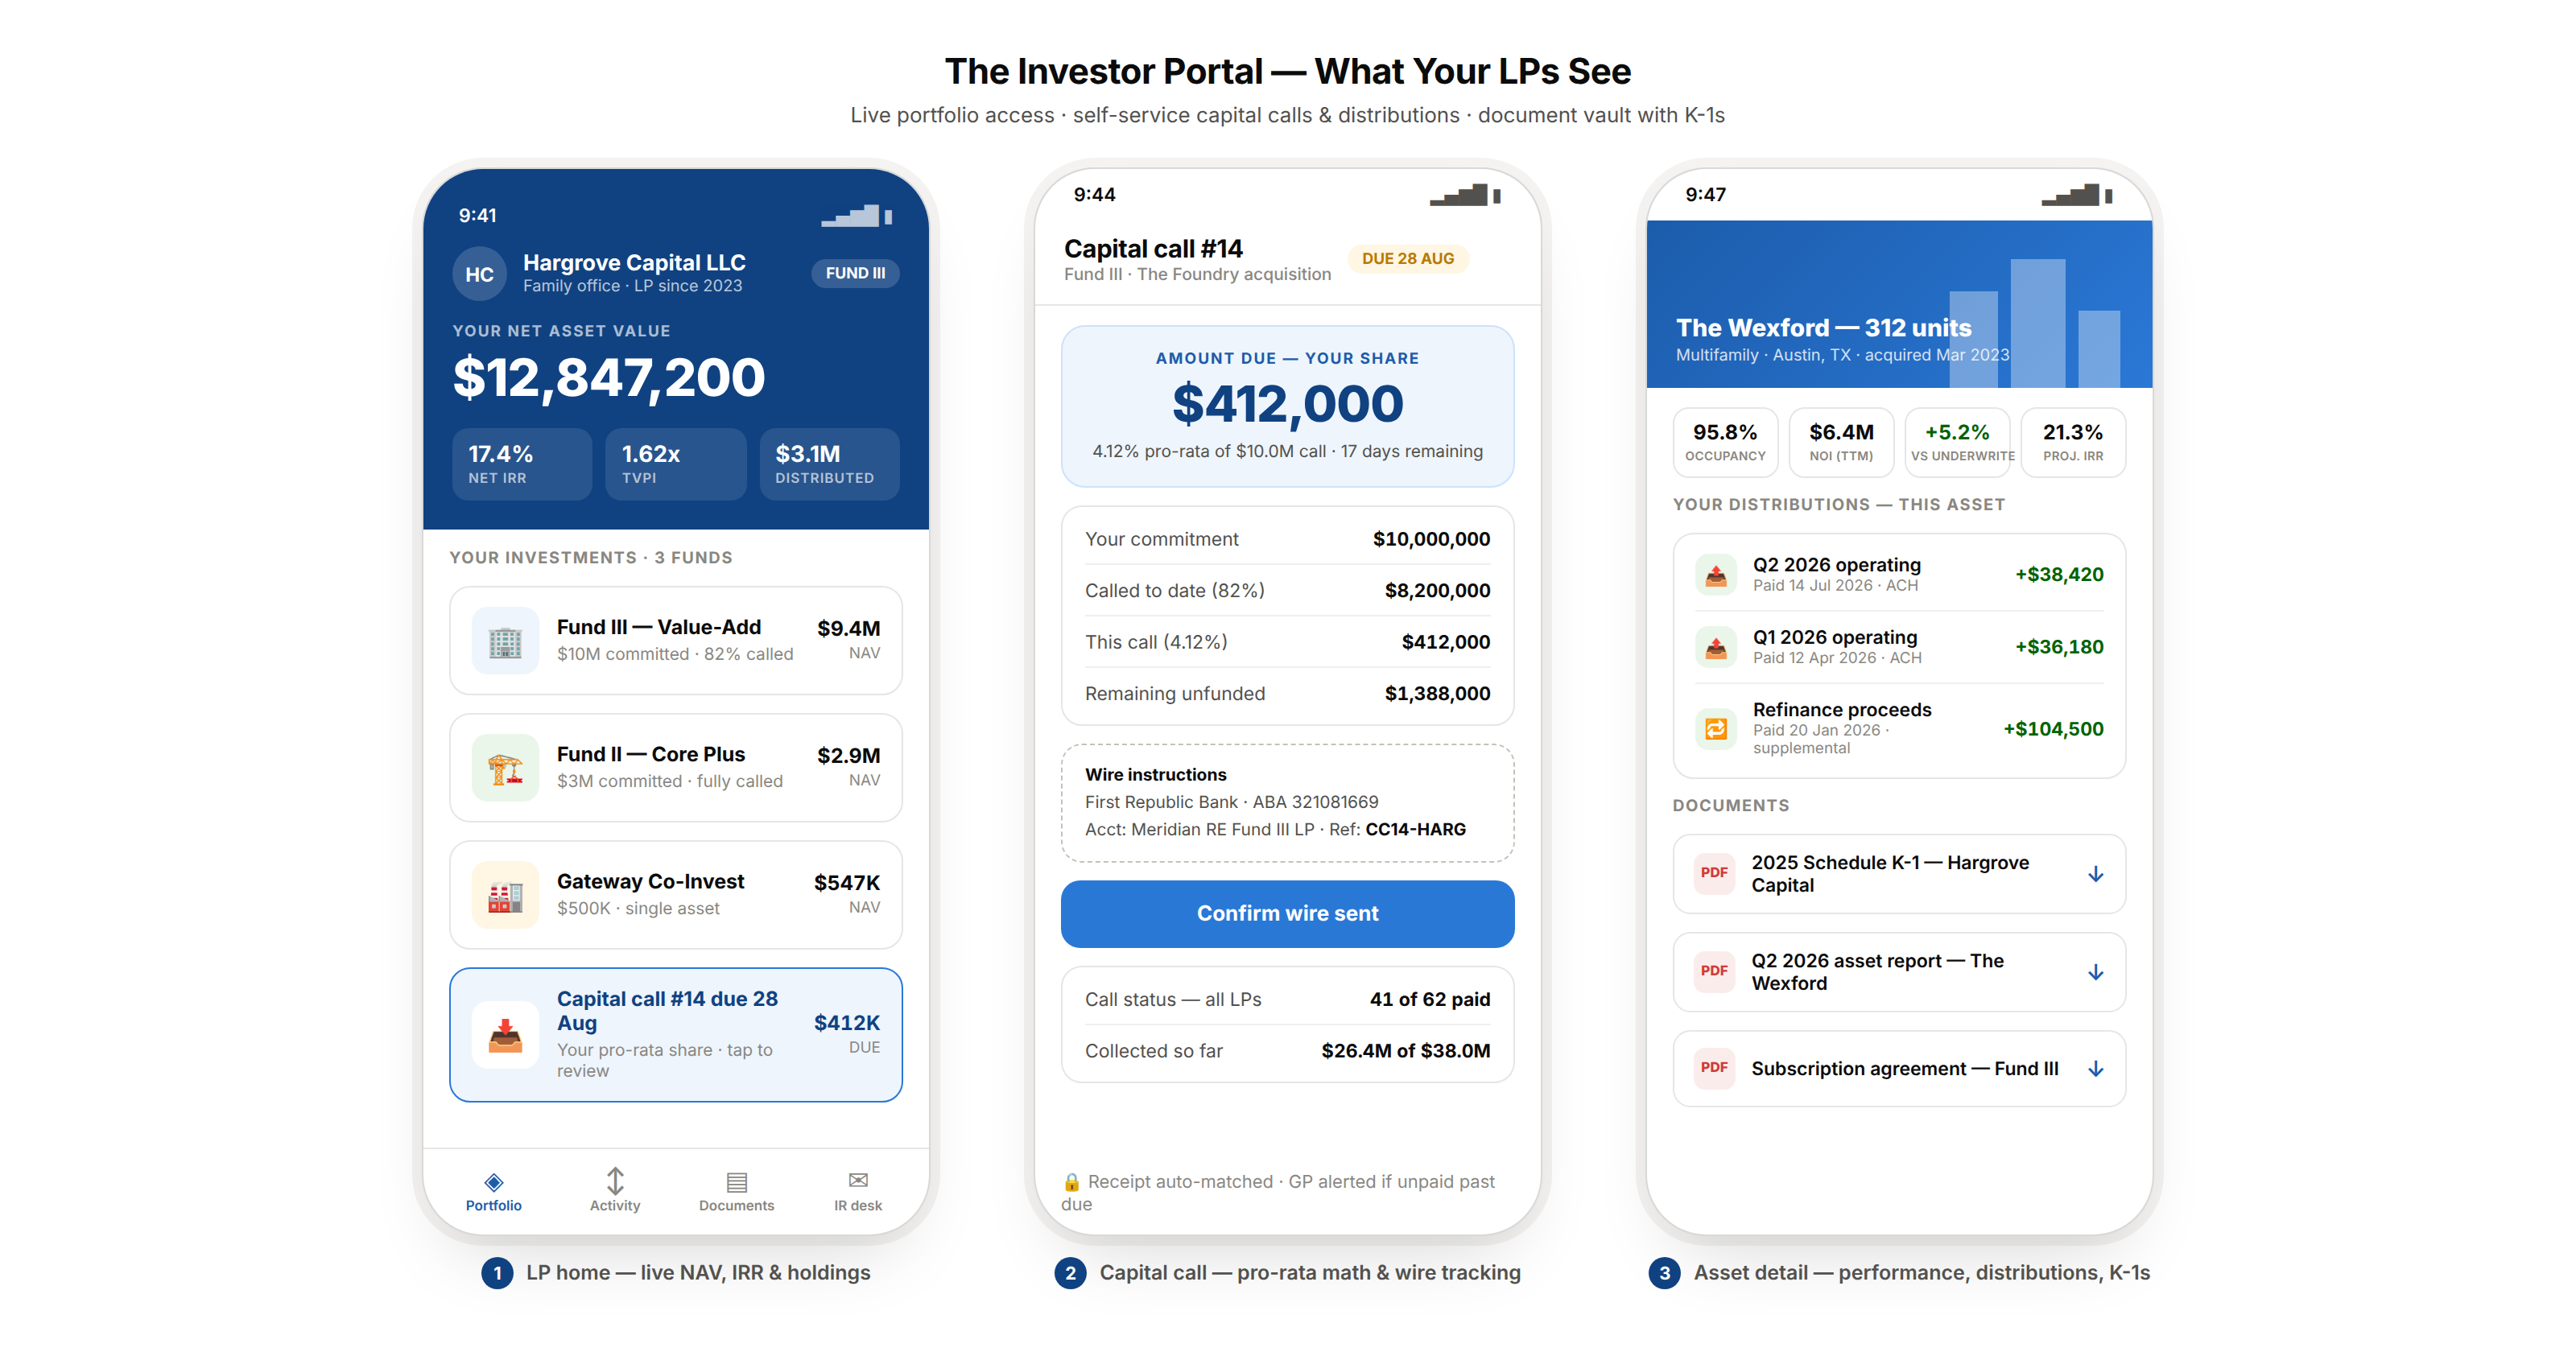
When the fund identifies a new investment, a capital call is issued to LPs for their pro-rata share of the required equity. The platform:
Calculates each LP’s capital call amount based on their commitment and the fund’s deployment schedule. Generates and sends formal capital call notices with bank wire instructions. Tracks receipt of capital from each LP.
Alerts the GP when any LP’s capital call is unpaid past the due date.
The investor portal:
| Feature | Details |
| Portfolio overview | All investments, NAV, unrealised and realised returns |
| Investment detail | Individual asset performance, occupancy, NOI, value estimate |
| Distribution history | All distributions received, dates, amounts |
| Capital account statement | Contributions, distributions, current balance |
| Document vault | PPM, subscription agreement, K-1s, quarterly reports |
| Capital call notices | Current and historical capital calls |
| IR messaging | Secure messaging to the GP’s investor relations team |
| Module | Cost Range (USD) | Notes |
| Deal pipeline management | $6K – $12K | CRM with real estate workflow |
| Financial underwriting model engine | $10K – $18K | Standardised model, comp integration |
| Market data integration (CoStar/CBRE) | $6K – $12K | Comparable analysis automation |
| Sensitivity analysis + scenario modelling | $5K – $10K | |
| IC memo generation (AI-assisted) | $6K – $12K | LLM-powered draft generation |
| IC voting workflow | $4K – $8K | |
| Capital stack + waterfall modelling | $8K – $15K | Complex promote and preferred logic |
| LP onboarding + KYC/AML | $6K – $12K | Accreditation, OFAC screening |
| Capital call management | $5K – $10K | |
| Investor portal (web app + mobile ap) | $8K – $15K | |
| Asset management + NOI tracking | $8K – $15K | |
| Portfolio analytics (IRR, TVPI, MOIC) | $5K – $10K | |
| Reporting + K-1 management | $5K – $10K | |
| AWS + VAPT + Year 1 ops | $5K – $10K | |
| Total | $87K – $169K | Full real estate investment platform |
Contact: mayank@engineerbabu.com
A waterfall distribution model defines the order and formula by which cash flows from a real estate investment are distributed among investors and the general partner. A typical waterfall has three tiers: first, return of capital, investors receive back their invested capital before any profits are distributed; second, preferred return, investors receive a cumulative preferred return (typically 8% annual) on their capital before the GP participates; and third, profit split, after the preferred return hurdle is met, remaining profits are split between LPs and the GP according to the agreed ratio, with the GP’s disproportionate share of profits above the hurdle called the “promote” or “carried interest.” A platform calculates the waterfall by modelling every cash flow event, quarterly operating distributions, refinancing proceeds, and sale proceeds, through each tier of the distribution model, tracking cumulative distributions per investor and calculating when each tier threshold is crossed.
Internal Rate of Return (IRR) is the discount rate at which the net present value of all cash flows from an investment, including the initial equity investment as a negative cash flow, all operating distributions, and the eventual sale proceeds, equals zero. In plain terms, IRR represents the annualised return on the invested capital, accounting for the timing of cash flows. IRR is the primary metric in real estate private equity because it captures both the magnitude of returns and the timing, a deal that returns 2x equity in 3 years has a much higher IRR than one that returns 2x equity in 7 years, even though both doubled the invested capital. IRR comparisons across different investments, funds, and managers require consistent assumptions about timing and capital deployment, which is why a standardised investment platform, rather than bespoke Excel models, produces more comparable and auditable IRR calculations.
In the US, raising capital from investors for a real estate fund typically relies on Regulation D (Reg D) exemptions from SEC registration. The most common exemption, Rule 506(b), allows raising unlimited capital from up to 35 non-accredited but sophisticated investors and an unlimited number of accredited investors, with no general solicitation permitted. Rule 506(c) allows general solicitation but requires all investors to be accredited and verified. Accredited investors, individuals with $1M net worth excluding primary residence or $200K annual income ($300K with spouse), must be verified through documentation or third-party verification. The platform automates accredited investor verification through document upload and AI-powered verification workflows, generates the required Form D filing 15 days after the first sale, maintains a subscriber database for SEC audit purposes, and enforces AML/KYC requirements including OFAC sanctions screening for all investors.