How to Build a Dealer Management System, Vehicle Inventory, Sales CRM, Service, Parts, and Finance 2026


Create engaging, high-performance mobile applications tailored to your business needs. We craft future-ready apps that offer smooth user experiences on all devices.
Build robust and scalable websites and CMS platforms that help you manage content effortlessly. Our development ensures a seamless digital presence.
Launch secure, feature-rich online stores with intuitive shopping experiences. We build tailored eCommerce platforms designed for growth.
Design captivating games with immersive gameplay and stunning graphics. From concept to launch, we build engaging experiences that players love.
Enhance your customer relationships with customized Salesforce implementations. Drive growth and efficiency with smarter CRM solutions.
Harness artificial intelligence and machine learning to automate workflows and gain actionable insights. Our AI transforms data into smart decisions.
Accelerate your software delivery lifecycle with continuous integration, delivery, and infrastructure automation to boost efficiency.
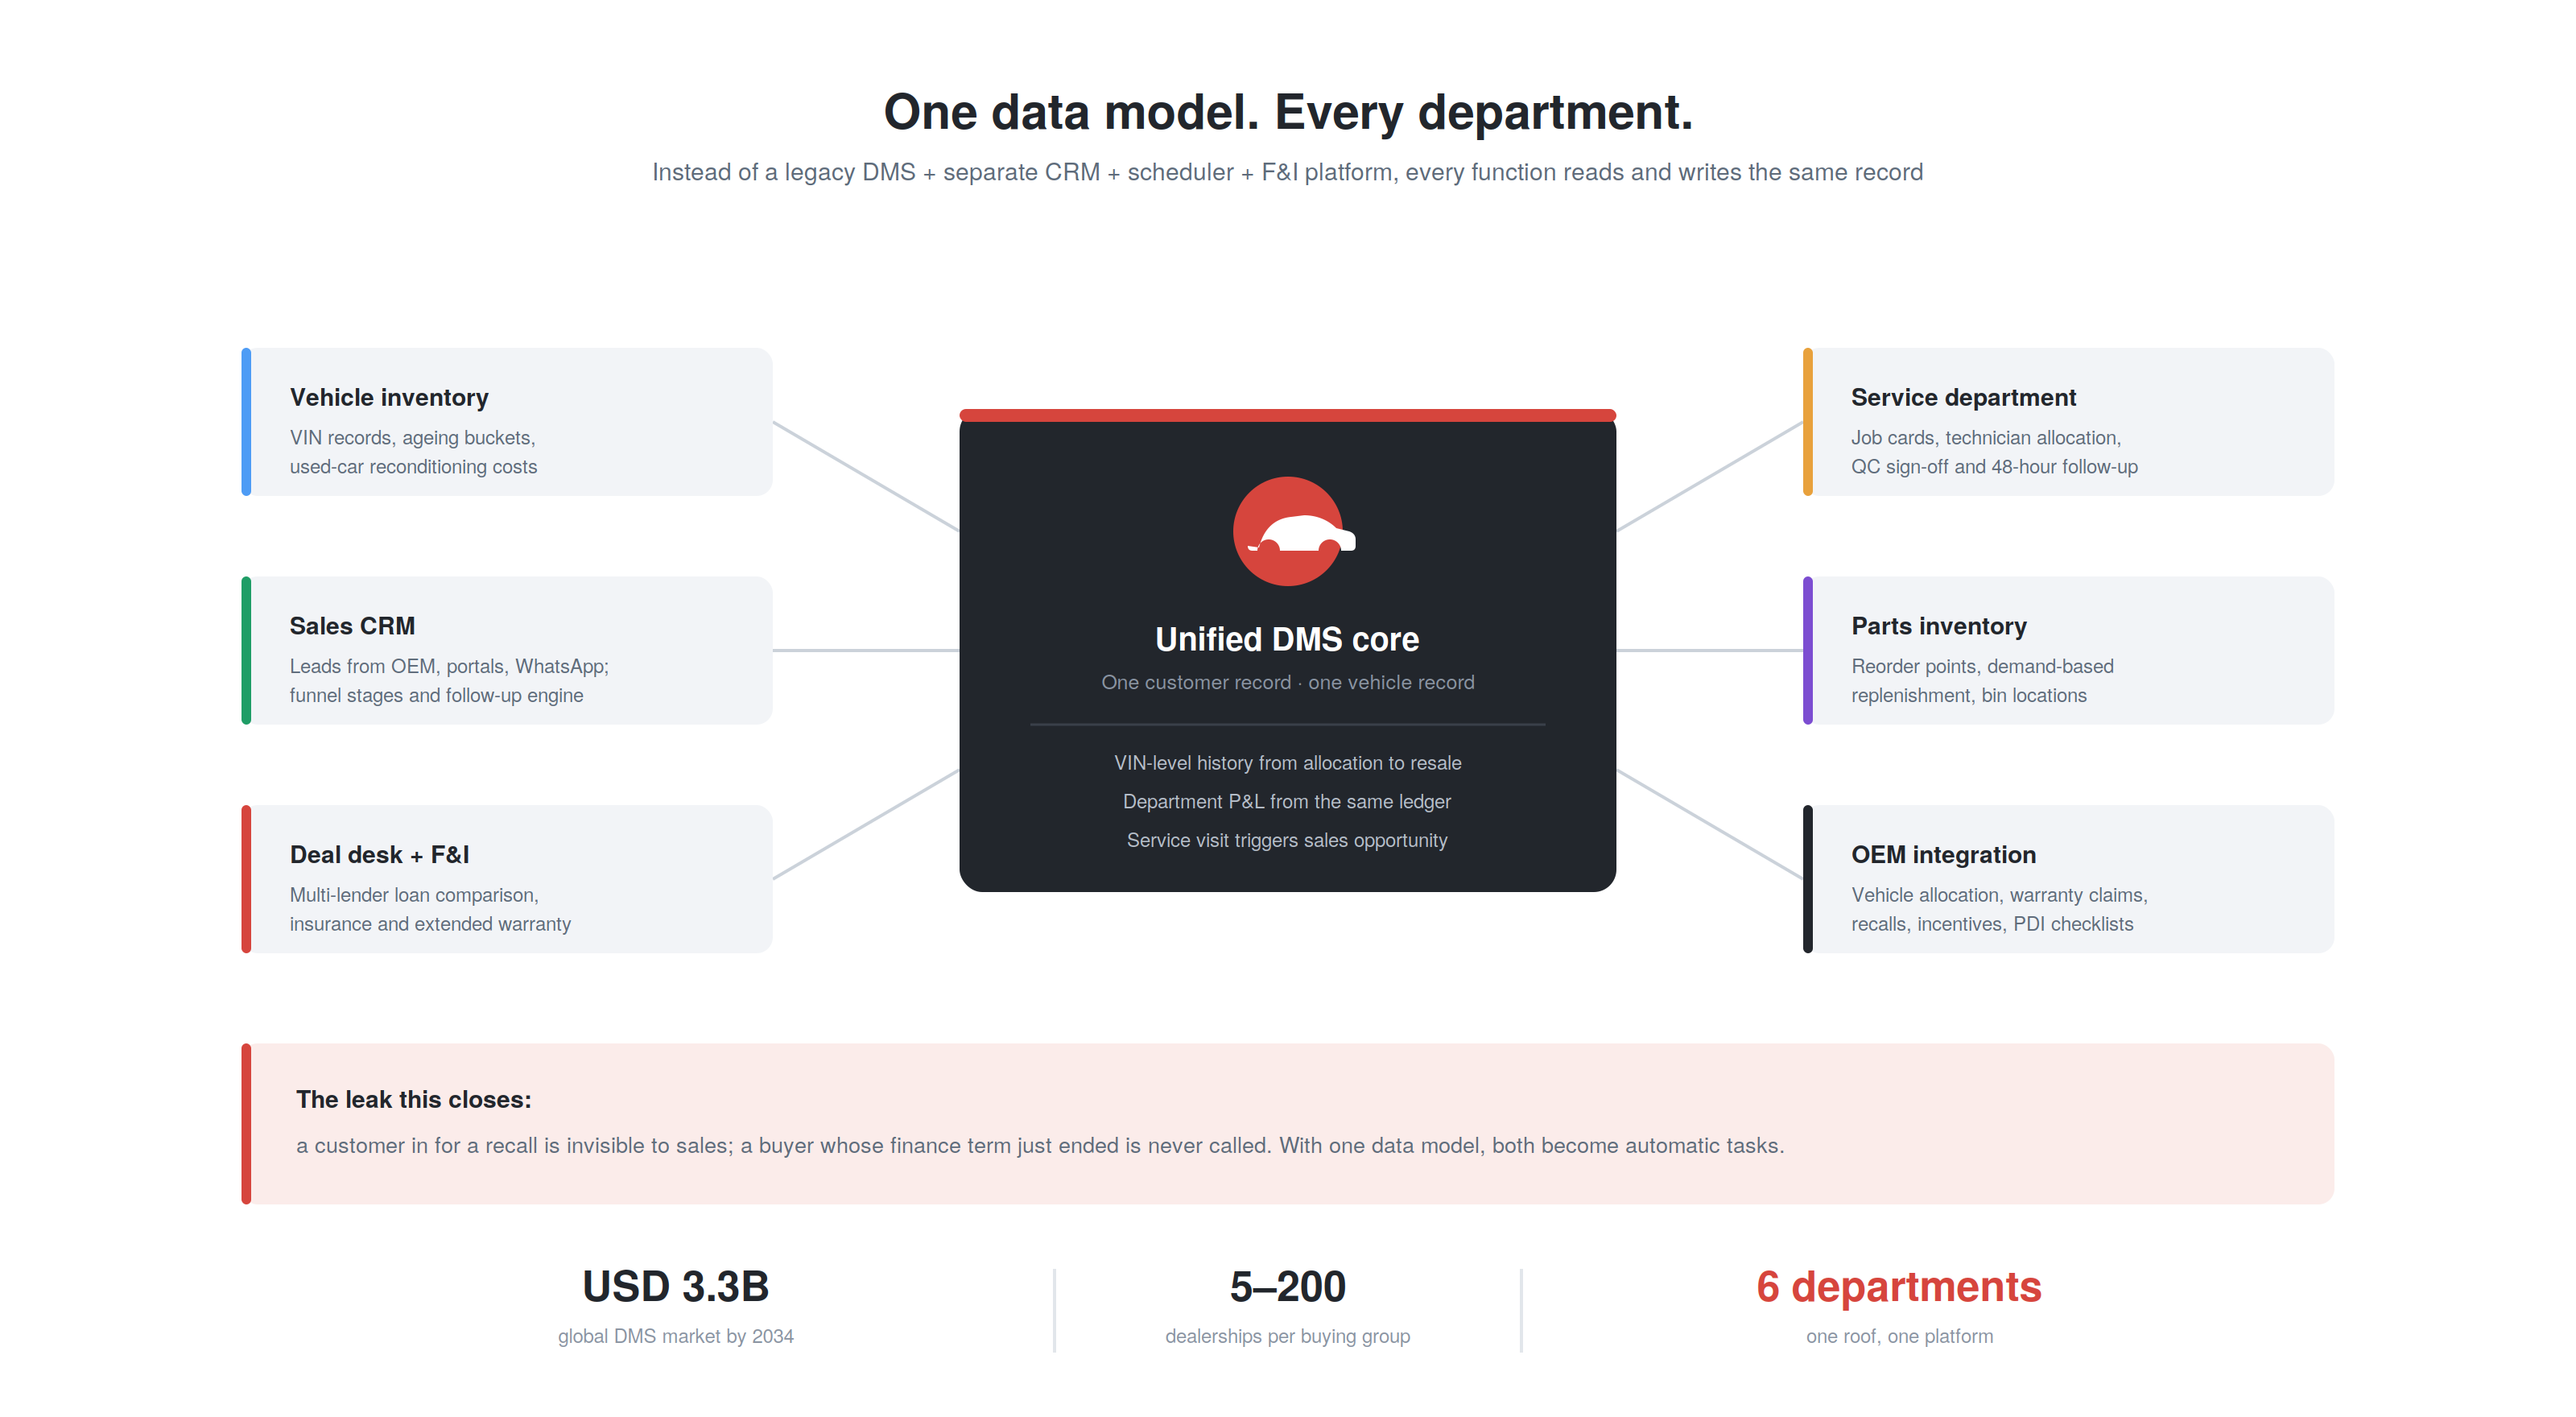
An automotive dealership in 2026 is a multi-department business that happens to sell cars. New vehicle sales, used vehicle trade-ins and reconditioning, service and repair, parts and accessories, finance and insurance (F&I), and extended warranty, all operate under one roof but with distinct workflows, distinct revenue models, and distinct customer touchpoints.
Most dealerships manage these departments through a combination of a legacy DMS (typically Reynolds and Reynolds or CDK Global), a separate CRM, a separate service scheduling tool, and a separate F&I platform that do not share data cleanly.
The result: a customer who brought their car for a service recall is never contacted by the sales team about the new model that just launched. A salesperson who sold a car 3 years ago has no idea the customer’s finance term just ended and they are likely looking for their next vehicle. Revenue leaks silently.
A dealer management system development process designed from the ground up, rather than patched together over decades, connects every dealership function in a single data model.
The global automotive DMS market is projected to reach USD 3311.88 million by 2034. The buyers are automotive OEM dealer networks, independent multi-brand dealerships, used car chains, and automotive groups managing 5 to 200 dealerships.
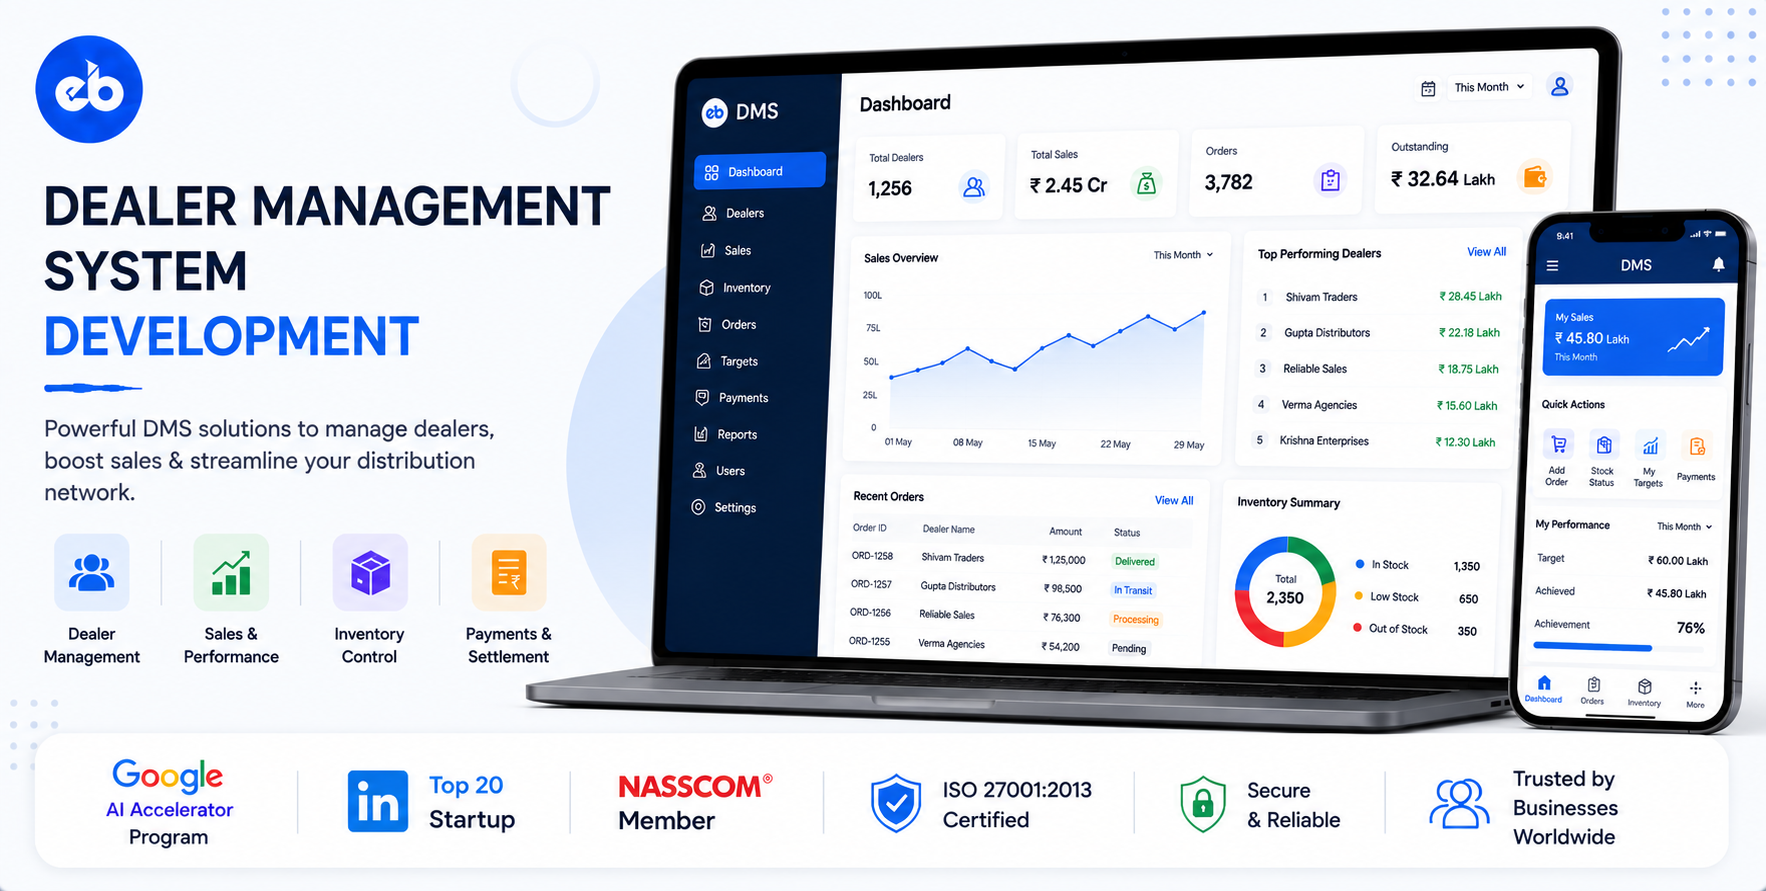
EngineerBabu built enterprise operations management for Adani Group and technology for 75+ YC-backed companies. CMMI Level 5. Google AI Accelerator 2024 Top 20. Contact: mayank@engineerbabu.com
| Department | DMS Function |
| Vehicle inventory management | New vehicle stock, used vehicle stock, vehicle profiles |
| Sales CRM | Lead management, test drives, deal management |
| Deal desk | Deal structuring, F&I, pricing approval |
| Finance and insurance | Loan applications, insurance, extended warranty |
| Service department | Appointment scheduling, job card, technician allocation |
| Parts department | Parts inventory, ordering, counter sales |
| Accounting | Revenue by department, P&L, manufacturer payable |
| Reporting | Sales performance, service efficiency, parts turnover |
| Customer portal | Service history, upcoming service reminders, finance details |
| OEM integration | Vehicle allocation, warranty claims, incentive management |
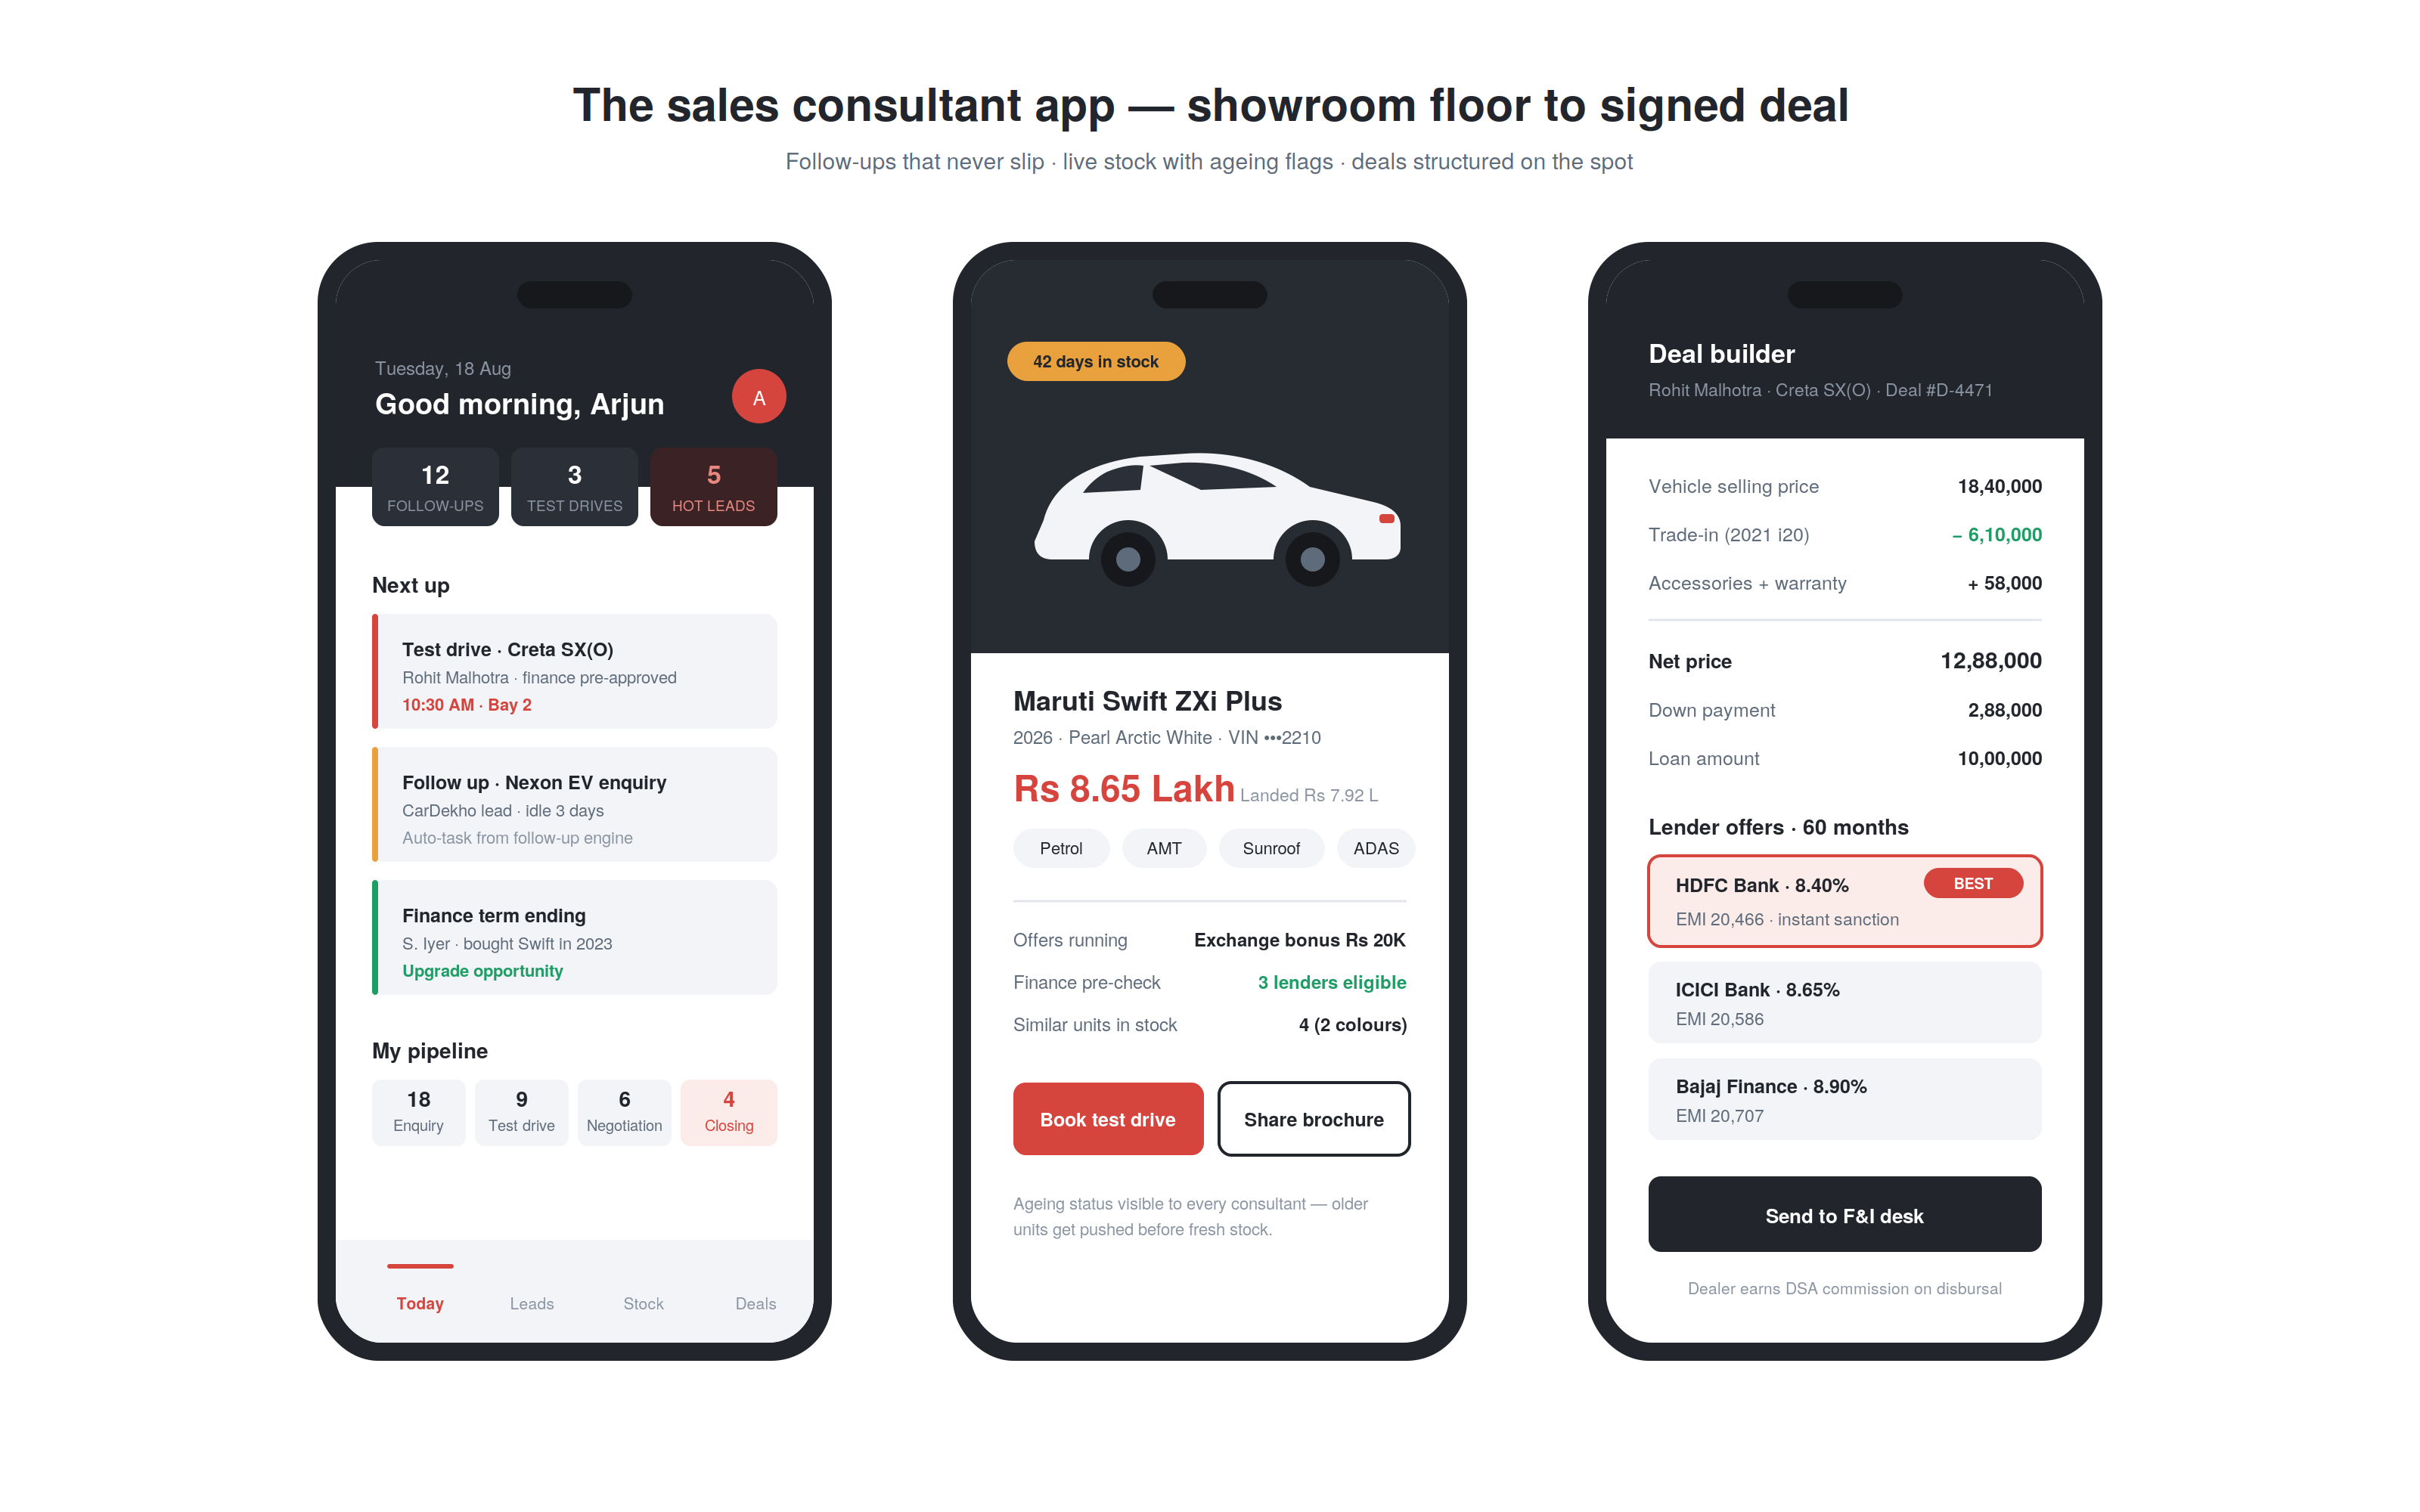
The vehicle master record:
Every vehicle in the dealership, new or used, has a comprehensive digital record:
| Field | Details |
| VIN (Vehicle Identification Number) | 17-character unique vehicle identifier |
| Make, model, variant | e.g., Maruti Suzuki Swift ZXi Plus |
| Year of manufacture | |
| Colour (exterior and interior) | |
| Engine and transmission | |
| Features and options | Sunroof, alloys, ADAS, navigation |
| Fuel type | Petrol, diesel, EV, hybrid |
| Kilometres (for used vehicles) | |
| Condition | New / Pre-owned / Certified pre-owned |
| Landed cost | For profitability tracking |
| Selling price | Listed price |
| Location | Which showroom or lot |
| Days in inventory | For ageing analysis |
| Photos | 360-degree photos for digital display |
The vehicle ageing dashboard:
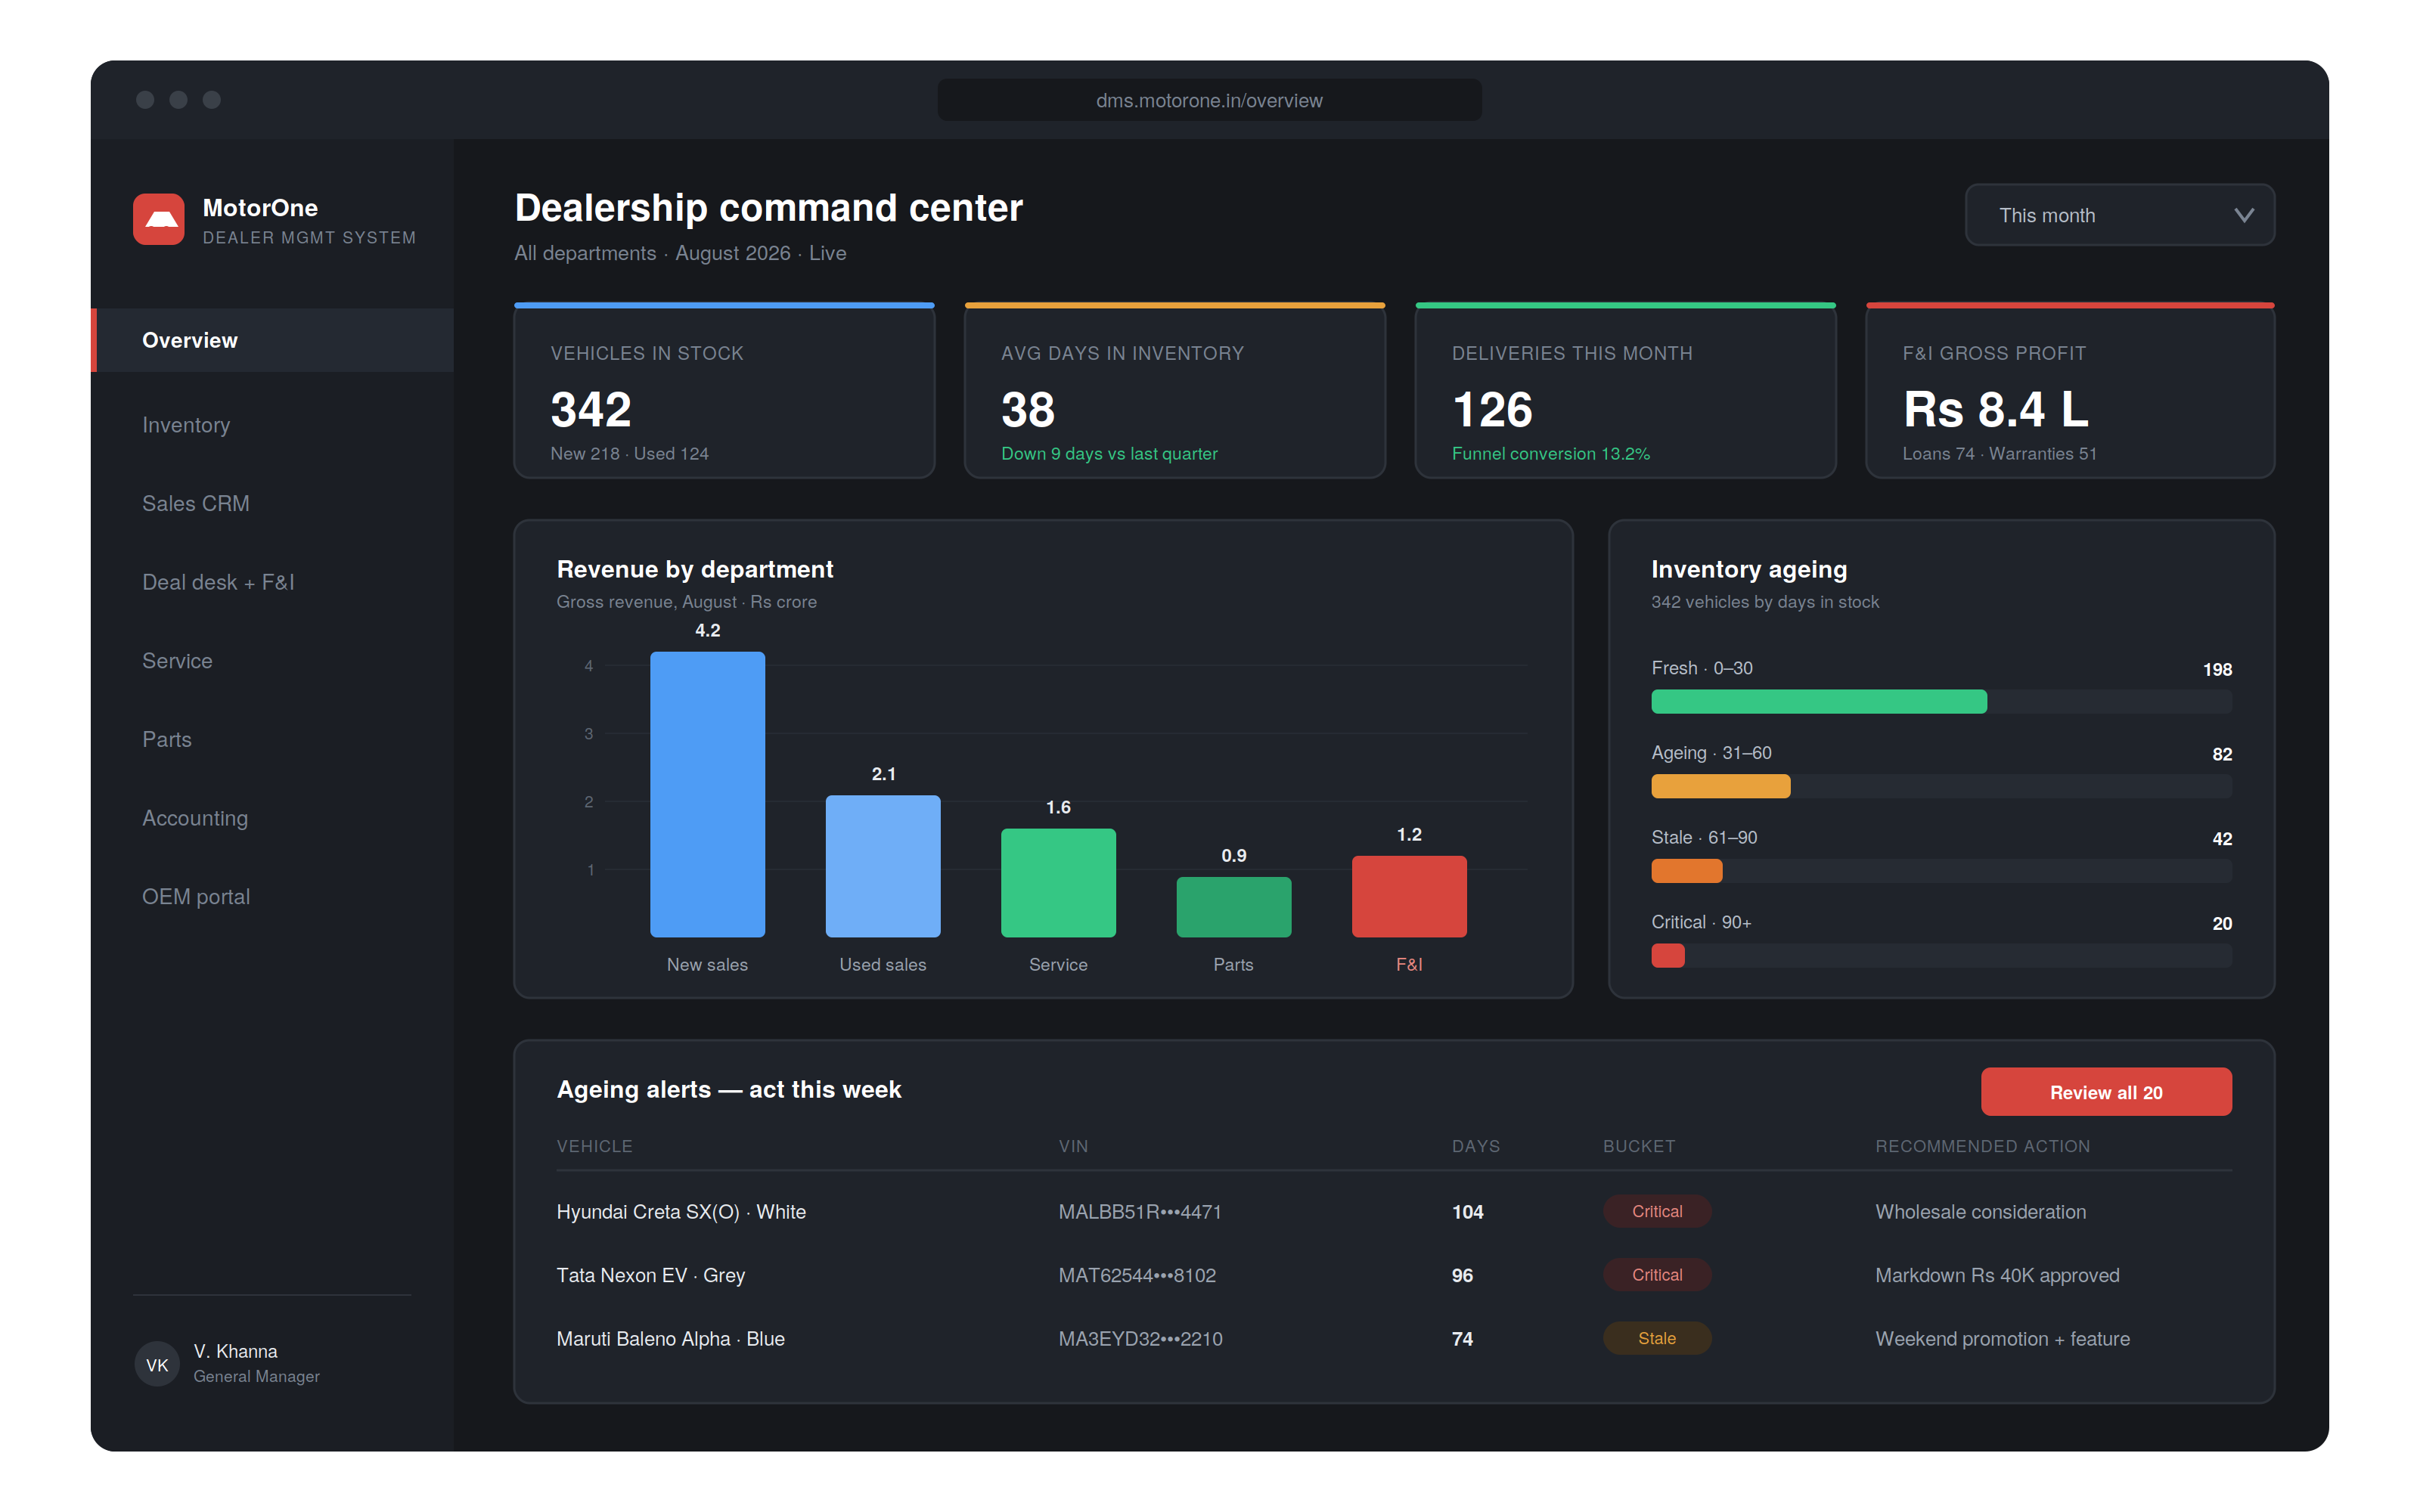
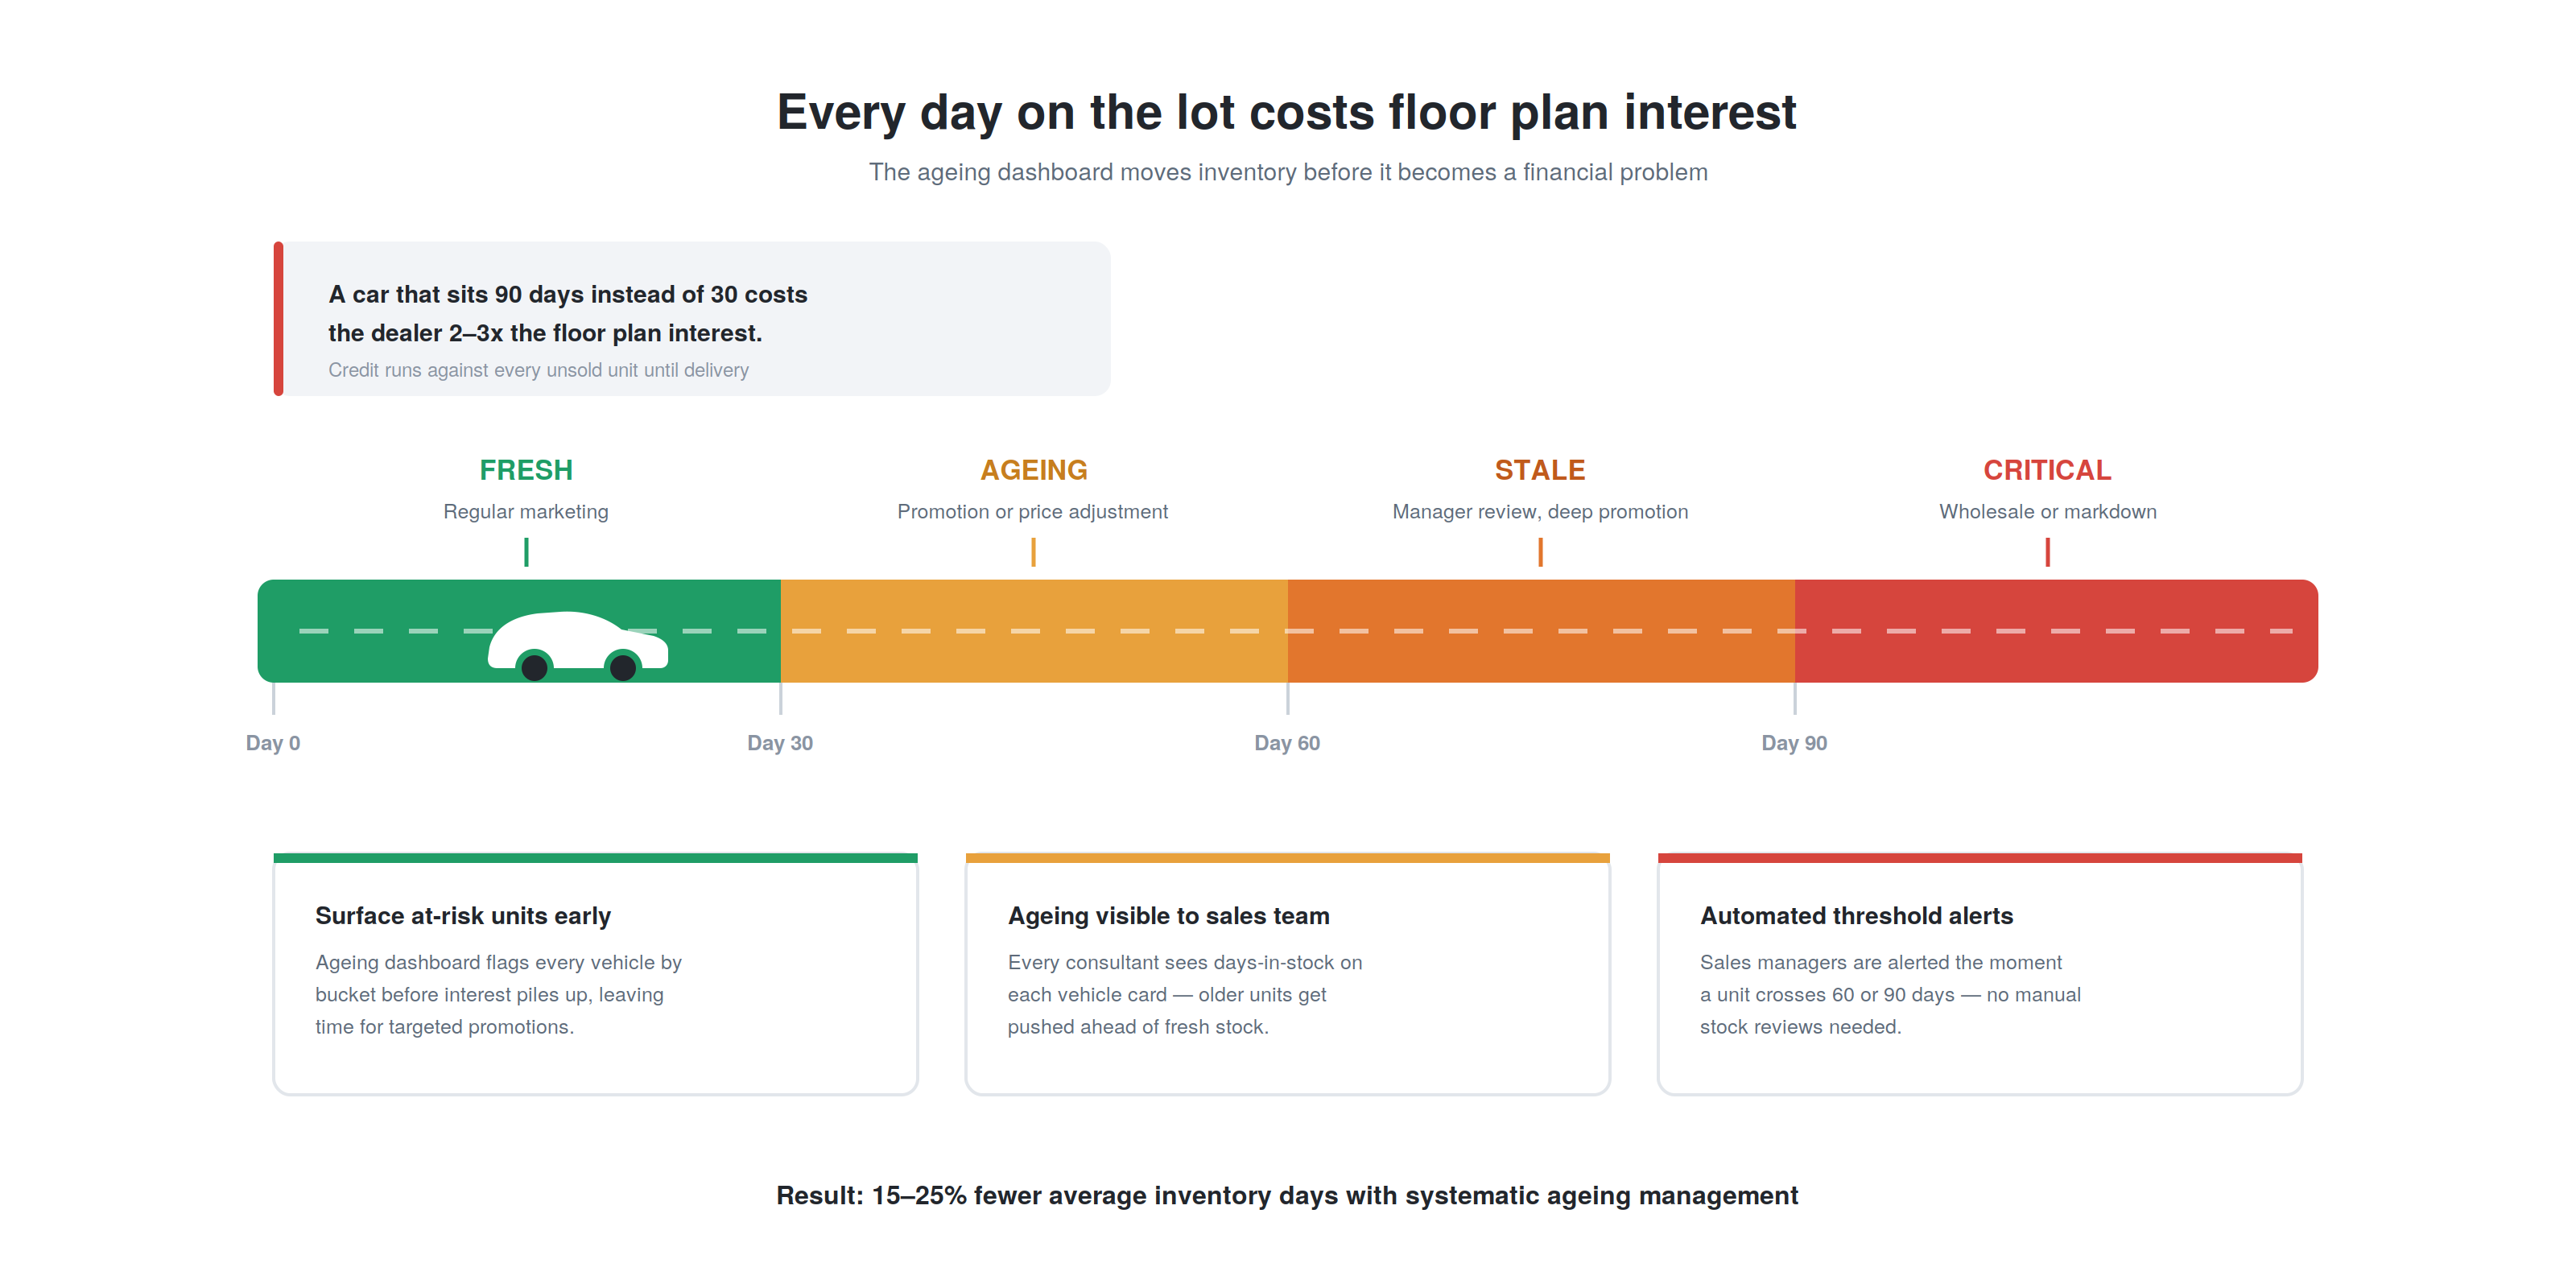
Inventory that does not turn costs the dealership floor plan interest. The ageing dashboard flags vehicles by days-in-inventory bucket:
| Bucket | Days | Status | Action |
| Fresh | 0–30 | Normal | Regular marketing |
| Ageing | 31–60 | Watch | Promotion or price adjustment |
| Stale | 61–90 | Alert | Manager review, significant promotion |
| Critical | 90+ | Escalate | Wholesale consideration, markdown |
Used vehicle reconditioning:
Every used vehicle trade-in or auction purchase goes through a reconditioning process, inspection, mechanical repair, cosmetic repair, detailing, and photography. The DMS tracks the reconditioning cost per vehicle (added to the landed cost) and the reconditioning status, which steps are complete, which are pending.
Lead sources in automotive:
| Lead Source | Integration | Volume |
| OEM website enquiry | OEM lead API or email webhook | High |
| Third-party portals (CarDekho, CarWale, Cars24) | Portal API | High |
| Walk-in | Manual entry at reception | Medium |
| Phone call | Call tracking integration | Medium |
| WhatsApp Business API | High | |
| Referral | Manual entry with referrer credit | Low-medium |
| Social media | Meta Lead Ads, Instagram DMs | Growing |
| Test drive events | Event CRM entry | Low |
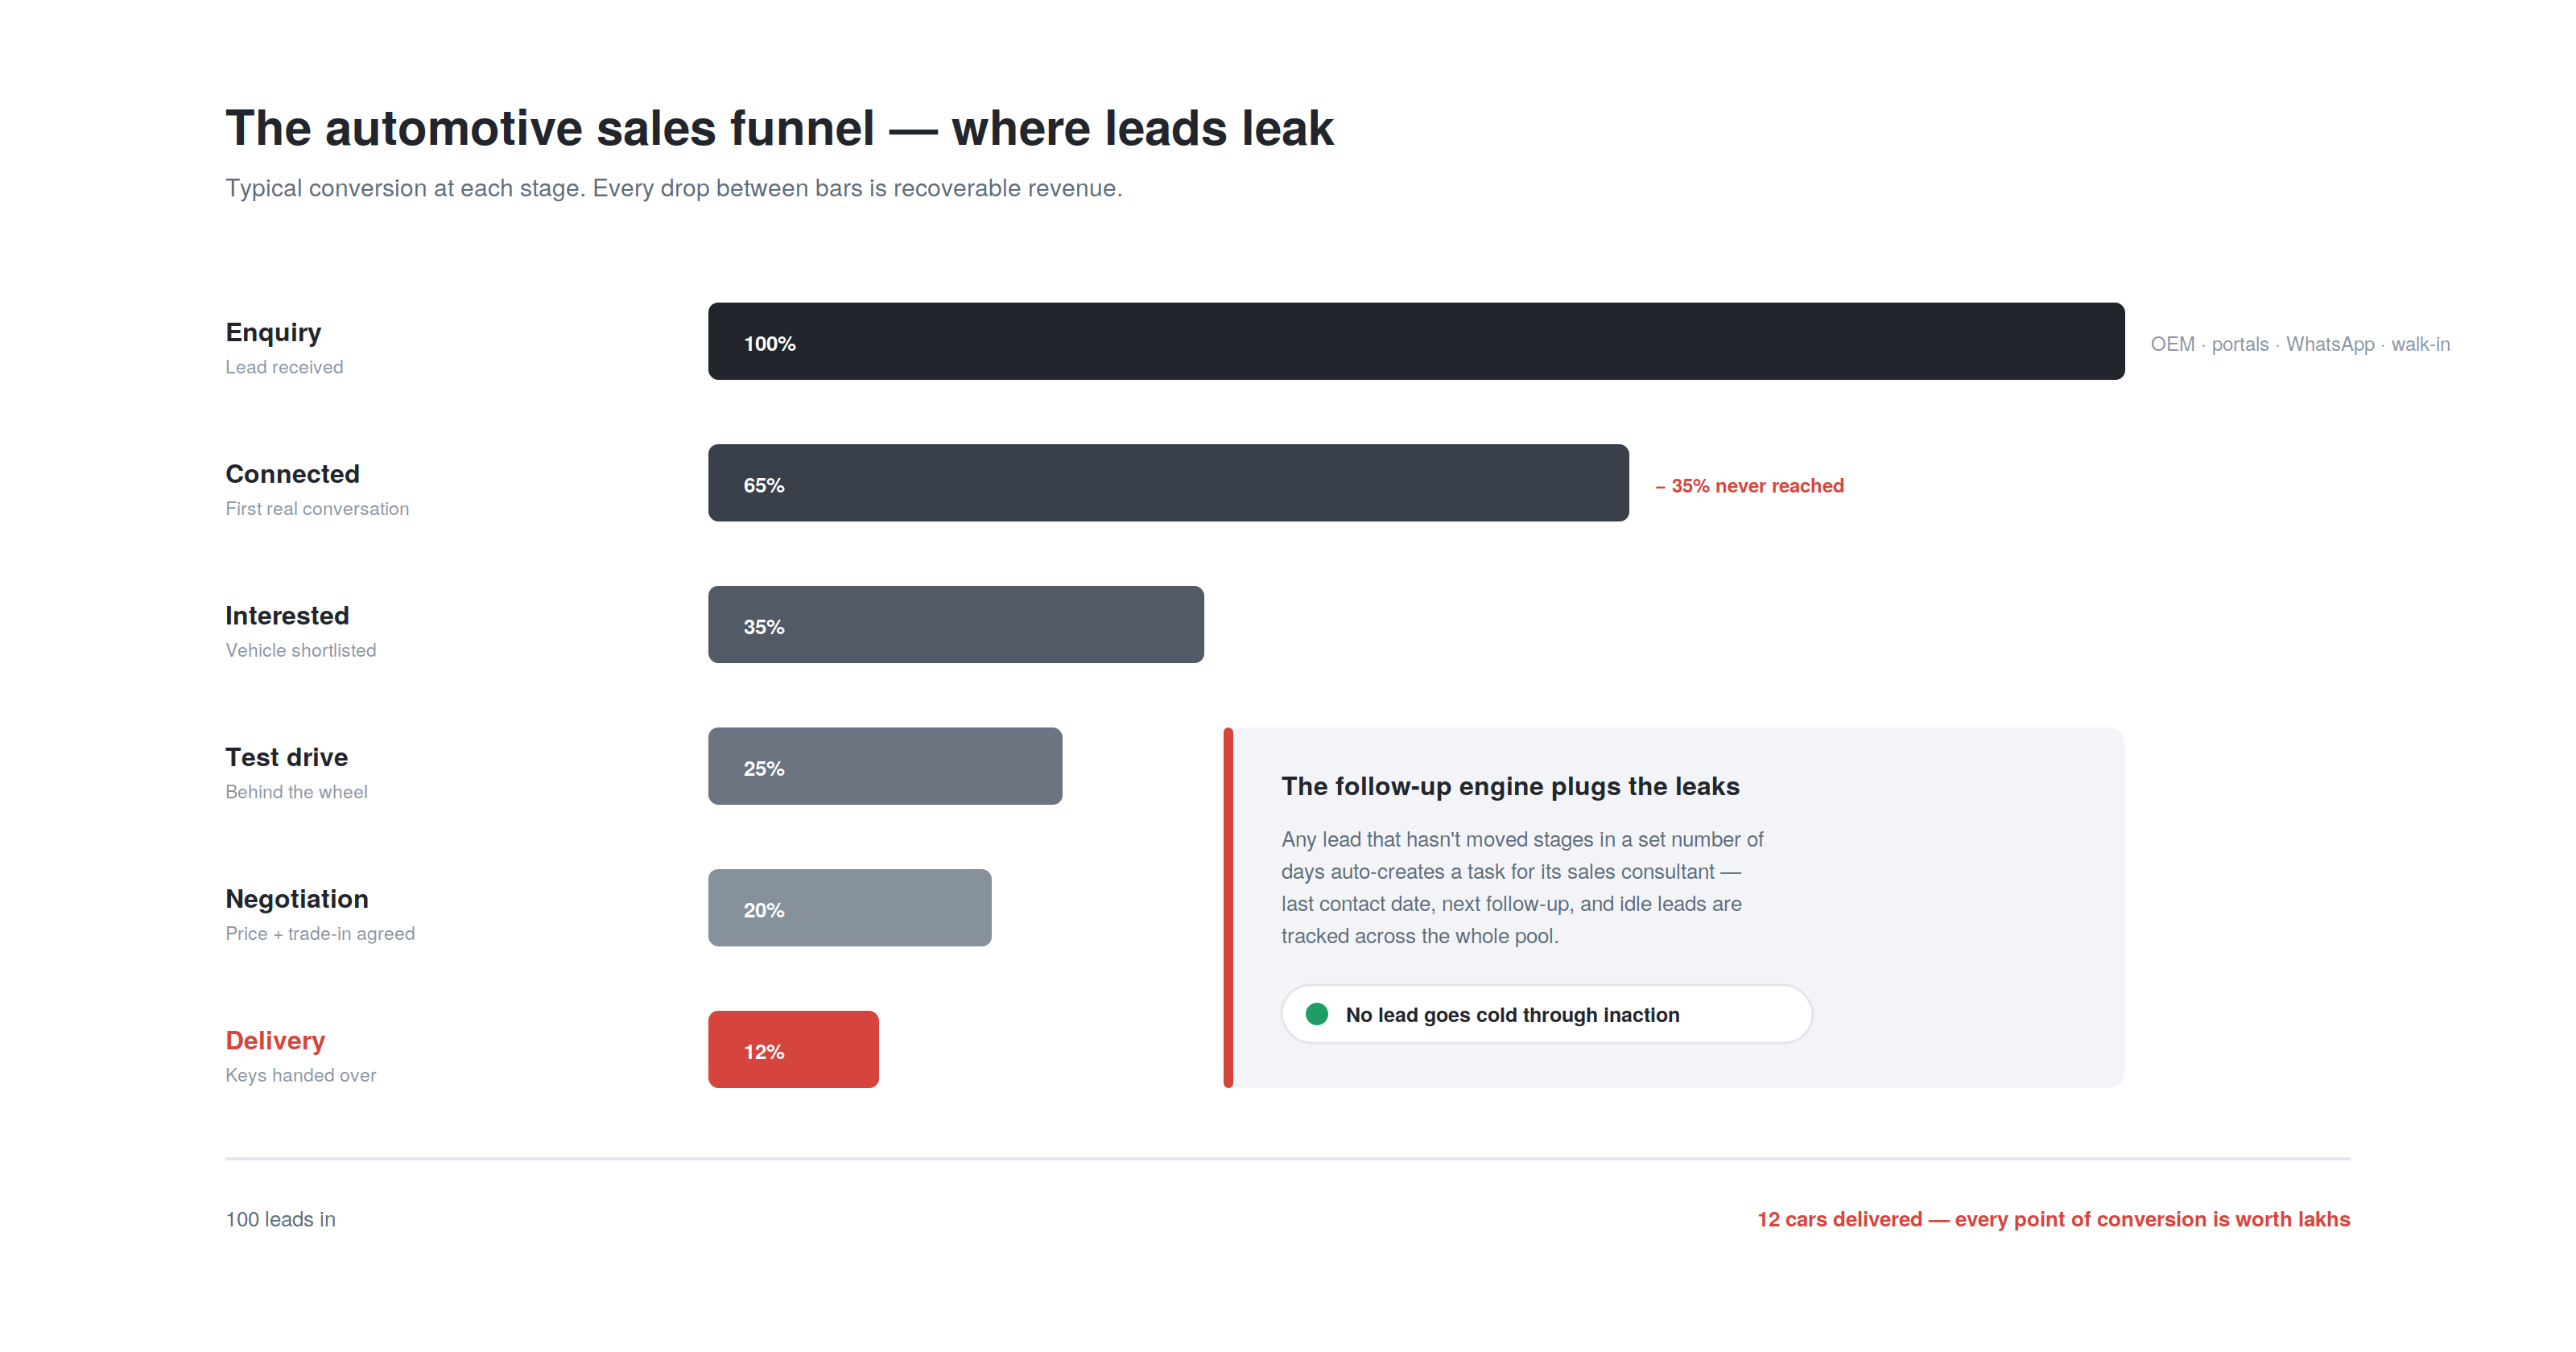
The sales funnel stages:
| Stage | Definition | Typical Conversion |
| Enquiry | Lead received, not yet contacted | 100% |
| Connected | First meaningful conversation | 60–70% |
| Interested | Specific vehicle shortlisted | 30–40% |
| Test drive | Test drive completed | 20–30% |
| Negotiation | Price and trade-in discussed | 15–25% |
| Deal agreed | Verbal or written commitment | 12–20% |
| Finance processing | Loan application submitted | 10–18% |
| Delivery | Vehicle delivered | 8–15% |
The follow-up engine:
Every lead that has not moved stages in a defined number of days generates a follow-up task for the assigned sales consultant.
The DMS tracks the last contact date, the next follow-up due date, and the outstanding tasks across the entire lead pool, ensuring no lead goes cold through inaction.
The deal structure:
A vehicle deal has multiple financial components:
| Component | Details |
| Vehicle selling price | Negotiated selling price |
| Trade-in value | Value given for customer’s existing vehicle |
| Net vehicle price | Selling price − Trade-in value |
| Accessories | Dealer-fitted accessories and their prices |
| Extended warranty | 3-year or 5-year extended warranty |
| Insurance | Motor insurance (first year typically included by OEM) |
| Finance charge | Interest income from dealer-arranged finance |
| Finance processing fee | Flat fee for loan processing |
| Down payment | Customer’s cash contribution |
| Loan amount | Net price − down payment |
| EMI | Monthly payment amount |
The F&I workflow:
Finance and Insurance is one of the highest-margin departments in a dealership. A well-managed F&I desk presents the customer with warranty, insurance, and finance options at the point of purchase, when they are most receptive.
The DMS integrates with multiple lenders, HDFC Bank, ICICI Bank, Kotak, SBI, Bajaj Finance, to compare loan offers and present the best rate to the customer, while the dealer earns the DSA commission on the disbursed loan.
Insurance integration with top motor insurance companies allows the F&I manager to issue the policy digitally at the time of delivery.
The service workflow:
| Step | Action | DMS Function |
| Appointment booking | Customer books service, online, phone, or walk-in | Calendar slot creation, service advisor assignment |
| Vehicle check-in | Vehicle arrives, advisor does walkaround | Digital vehicle condition recording, photo documentation |
| Job card creation | Services required listed and authorised | Labour and parts pre-estimate, customer sign-off |
| Technician allocation | Job assigned to available technician | Technician queue management |
| Parts requirement | Parts checked for availability | Parts inventory check, procurement if not available |
| Work in progress | Technician performs service | Job status updates from workshop bay |
| Quality check | Quality inspector verifies work | QC sign-off before customer handover |
| Billing | Invoice generated | Parts cost + labour charges |
| Delivery | Vehicle returned to customer | Customer signature, digital invoice |
| Follow-up | Post-service satisfaction call | 48-hour follow-up task |
The service productivity metrics:
| Metric | Calculation | Industry Benchmark |
| Billable hours per technician | Hours billed to customers / technician available hours | > 80% |
| Labour recovery rate | Actual labour billed / standard labour rate × hours | > 90% |
| First-time fix rate | Jobs completed correctly on first visit | > 85% |
| Customer pay vs warranty split | Revenue from customer vs OEM warranty claims | Varies |
| Return visitor rate | % of customers who return for next service | > 60% |
The parts inventory:
Every part in the dealership’s inventory, OEM parts, accessories, consumables, has a parts master record with:
| Field | Details |
| Part number | OEM part number |
| Description | Part name and specification |
| Compatible vehicles | Which models this part fits |
| Current stock | Quantity on hand |
| Bin location | Where in the parts warehouse |
| Reorder point | Minimum stock level before reorder |
| Economic order quantity | Optimal order quantity |
| Supplier | OEM parts supplier, dealer price |
| Selling price | Counter sales and workshop charge-out price |
The parts replenishment engine:
When stock falls below the reorder point, the system generates a parts order to the OEM distributor or local parts warehouse.
The replenishment engine uses demand history to calculate optimal order quantities, avoiding both stockouts (which delay vehicle service) and overstock (which ties up working capital).
What OEM integration enables:
| Data Flow | Direction | Purpose |
| Vehicle allocation | OEM → DMS | What vehicles the dealer is receiving next month |
| Warranty claims | DMS → OEM | Labour and parts claims for warranty repairs |
| Incentive programmes | OEM → DMS | Dealer volume incentives, model launch bonuses |
| PDI (Pre-Delivery Inspection) checklist | OEM → DMS | Mandatory pre-delivery checks |
| Recall notices | OEM → DMS | Vehicles in dealer inventory affected by recall |
| Sales reporting | DMS → OEM | Monthly retail sales by model |
| Service campaign notifications | OEM → DMS | Mandatory service campaigns for specific VINs |
The warranty claim workflow:
When a vehicle is repaired under warranty, the DMS generates a warranty claim, the labour operations performed, the parts replaced, the DMS job card number, and the technician’s certification.
The claim is submitted to the OEM in their required format (typically through the OEM’s dealer portal or API). The DMS tracks claim status, submitted, approved, rejected, paid.
| Module | Cost Range (USD) | Notes |
| Vehicle inventory management + VIN decode | $8K – $15K | |
| Sales CRM + lead management | $8K – $15K | Multi-source lead capture |
| Deal desk + F&I module | $8K – $15K | Lender integration, insurance |
| Service appointment + job card | $8K – $15K | |
| Technician allocation + workshop management | $5K – $10K | |
| Parts inventory + replenishment | $6K – $12K | |
| OEM integration (warranty, allocation) | $8K – $15K | Per OEM API |
| Customer portal + service history | $5K – $10K | |
| Accounting + department P&L | $8K – $15K | |
| Mobile app for sales consultants | $6K – $12K | |
| Analytics + performance dashboards | $5K – $10K | |
| AWS + VAPT + Year 1 ops | $5K – $10K | |
| Total | $80K – $154K | Full DMS platform |
Contact: mayank@engineerbabu.com
A Dealer Management System (DMS) is the comprehensive operating platform for an automotive dealership, managing every department including vehicle inventory, sales, service, parts, and accounting. A CRM (Customer Relationship Management) system manages only the customer and sales pipeline, it tracks leads, interactions, and deals but has no knowledge of vehicle inventory, service history, parts availability, or financial results. Most automotive dealerships use both: a DMS as the operational backbone for inventory, transactions, and accounting, and a CRM integrated with the DMS for sales process management. A modern integrated DMS includes CRM functionality natively, eliminating the integration complexity of maintaining two separate systems that need to share customer and vehicle data.
F&I stands for Finance and Insurance, the dealership department that arranges vehicle financing and insurance at the point of sale. It is typically the highest-margin department because: the dealer earns a DSA (Direct Selling Agent) commission from the lender for every loan arranged, typically 1 to 2% of the loan amount on a ₹6 lakh loan is ₹6,000 to ₹12,000; extended warranty products sold at the F&I desk carry margins of 40 to 60%; and insurance products sold have dealer commissions of 10 to 15% of premium. A dealer selling 100 vehicles per month with an average ₹5 lakh loan and a ₹25,000 extended warranty can generate ₹5 to 10 lakh in F&I gross profit per month from these products alone, comparable to or exceeding the vehicle sales margin.
Floor plan financing is how most dealerships finance their vehicle inventory, the OEM’s finance arm or a bank provides credit against each vehicle, and the dealer pays interest on each unit until it is sold. A vehicle that sits for 90 days instead of 30 days costs the dealer twice the floor plan interest. A DMS reduces ageing through three mechanisms: the ageing dashboard surfaces at-risk inventory before it becomes a financial problem, giving managers time to act with targeted promotions or price adjustments; the sales team sees ageing status on every vehicle in their inventory view, creating awareness and motivation to actively push older units; and the system sends automated alerts to sales managers when units cross defined ageing thresholds. Dealerships implementing systematic DMS-driven ageing management typically reduce average inventory days by 15 to 25%, meaningfully reducing floor plan interest cost.