How to Build a Supply Chain Control Tower, Multi-Tier Visibility, Disruption Intelligence, Risk Scoring, and Decision Automation 2026


Create engaging, high-performance mobile applications tailored to your business needs. We craft future-ready apps that offer smooth user experiences on all devices.
Build robust and scalable websites and CMS platforms that help you manage content effortlessly. Our development ensures a seamless digital presence.
Launch secure, feature-rich online stores with intuitive shopping experiences. We build tailored eCommerce platforms designed for growth.
Design captivating games with immersive gameplay and stunning graphics. From concept to launch, we build engaging experiences that players love.
Enhance your customer relationships with customized Salesforce implementations. Drive growth and efficiency with smarter CRM solutions.
Harness artificial intelligence and machine learning to automate workflows and gain actionable insights. Our AI transforms data into smart decisions.
Accelerate your software delivery lifecycle with continuous integration, delivery, and infrastructure automation to boost efficiency.
Hire app developers ready to turn your ideas into sleek, high-performing mobile apps for any platform.
Bring in frontend pros who craft smooth, beautiful, and user-friendly interfaces that your visitors will love.
Get backend developers who build fast, secure, and reliable systems to keep everything running behind the scenes.
Hire eCommerce developers who build secure, scalable online stores designed to offer seamless shopping and grow your sales.
Get dedicated developers committed to your projects, delivering consistent quality and speed as an extension of your team.
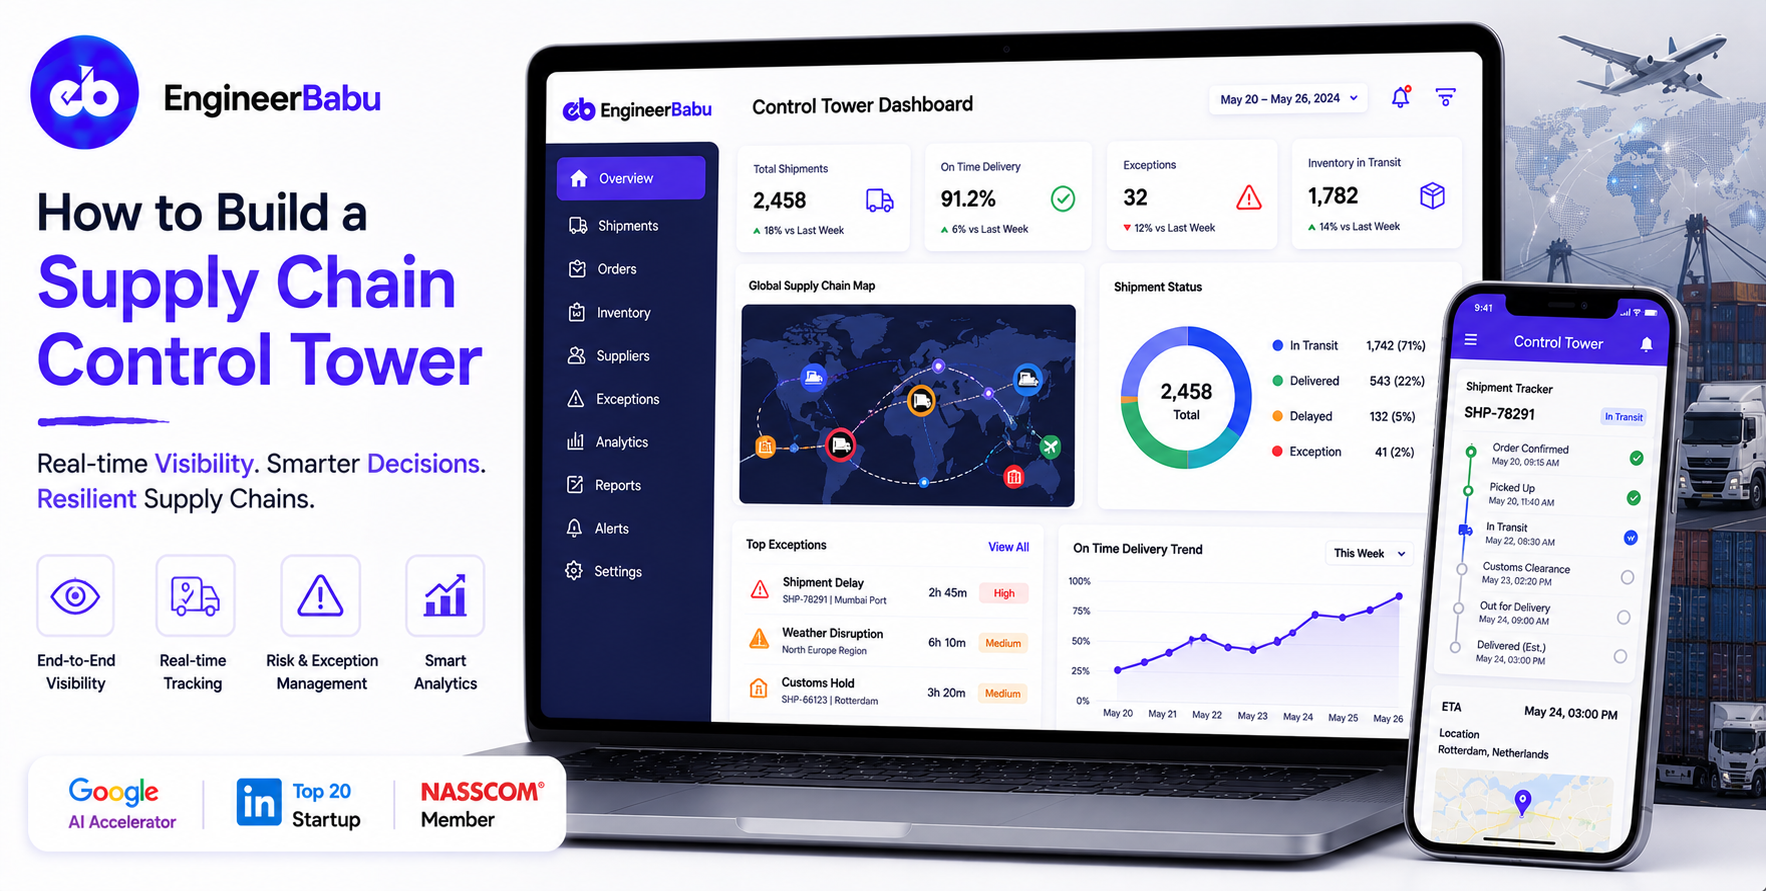
The COVID supply chain crisis taught every enterprise the same lesson: they had no idea what was happening beyond their tier-1 suppliers. They could see what their direct suppliers were doing. They had no visibility into what their suppliers’ suppliers were doing, and that is where the disruption was originating.
A tier-3 component manufacturer in Wuhan shutting down in January 2020 cascaded into automotive production halts in Europe and the US by March. Nobody saw it coming because nobody had the systems to see it.
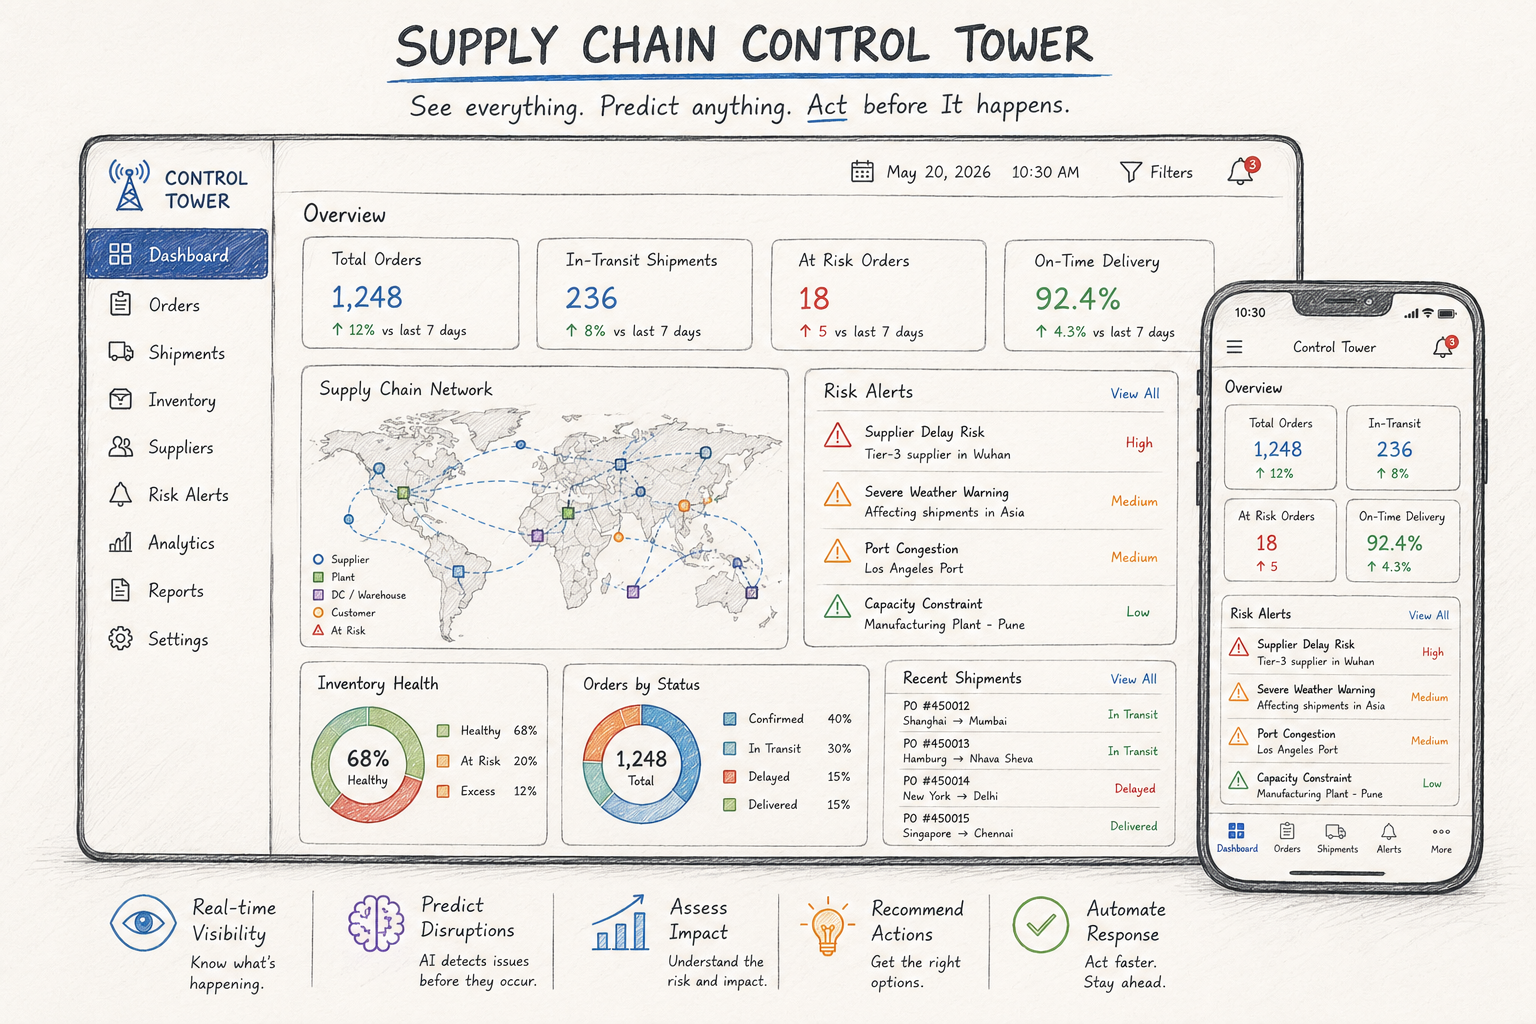
A supply chain control tower is the unified intelligence layer that gives supply chain leaders end-to-end visibility, from raw material origin through multi-tier manufacturing through logistics through customer delivery, with the AI-driven disruption detection and decision automation that turns visibility into action before disruptions become crises.
The global supply chain visibility market is projected to reach $10.6 billion by 2034. The buyers are manufacturers, retailers, 3PLs, and distributors whose supply chains are complex enough that spreadsheets and ERP reports can no longer keep pace with the speed at which disruptions happen.
EngineerBabu built enterprise operations management for Adani Group, one of India’s most complex multi-sector supply chains, and supply chain intelligence for Simba Beer. CMMI Level 5. Google AI Accelerator 2024 Top 20. Contact: mayank@engineerbabu.com
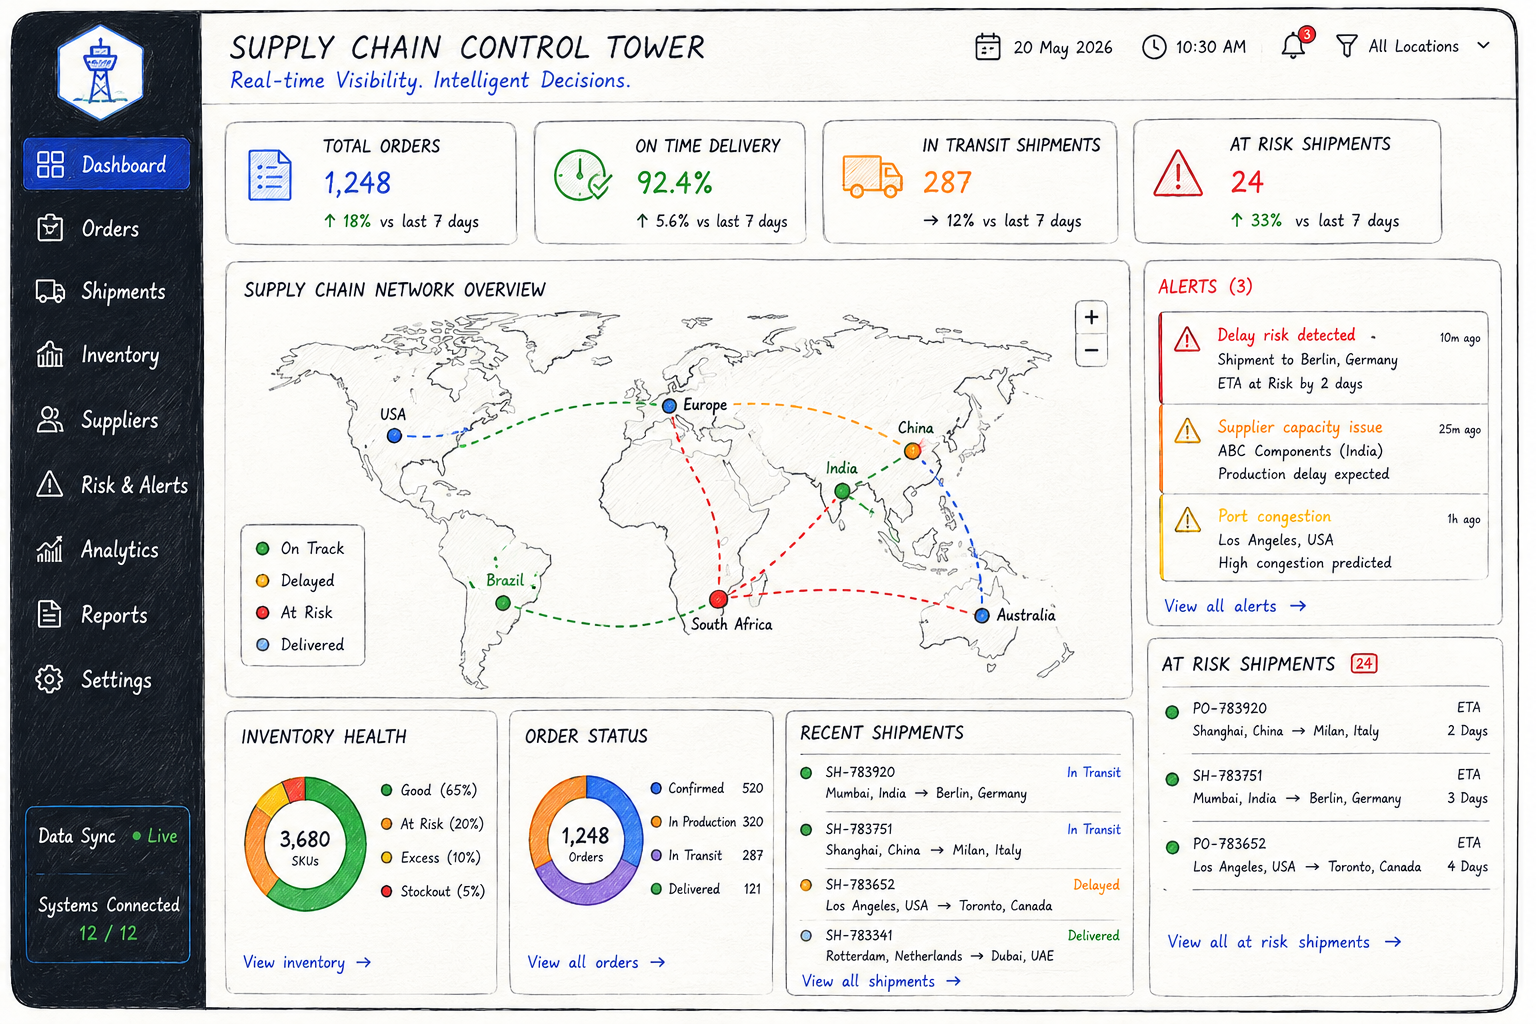
A supply chain control tower is not a tracking dashboard. A dashboard shows you what has happened. A control tower shows you what is happening, what is about to happen, what the impact will be if it does, and what options you have to respond.
| Layer | Function | Value |
| Visibility | Real-time status of every order, shipment, and inventory position | You know what is happening |
| Intelligence | AI-driven pattern detection and anomaly flagging | You know what is wrong |
| Analytics | Historical analysis, trend identification, risk scoring | You know why and how serious |
| Action | Recommended responses, automated workflows, decision support | You know what to do |
Most supply chain platforms deliver Layer 1. Good ones deliver Layers 1 and 2. A genuine control tower delivers all four.
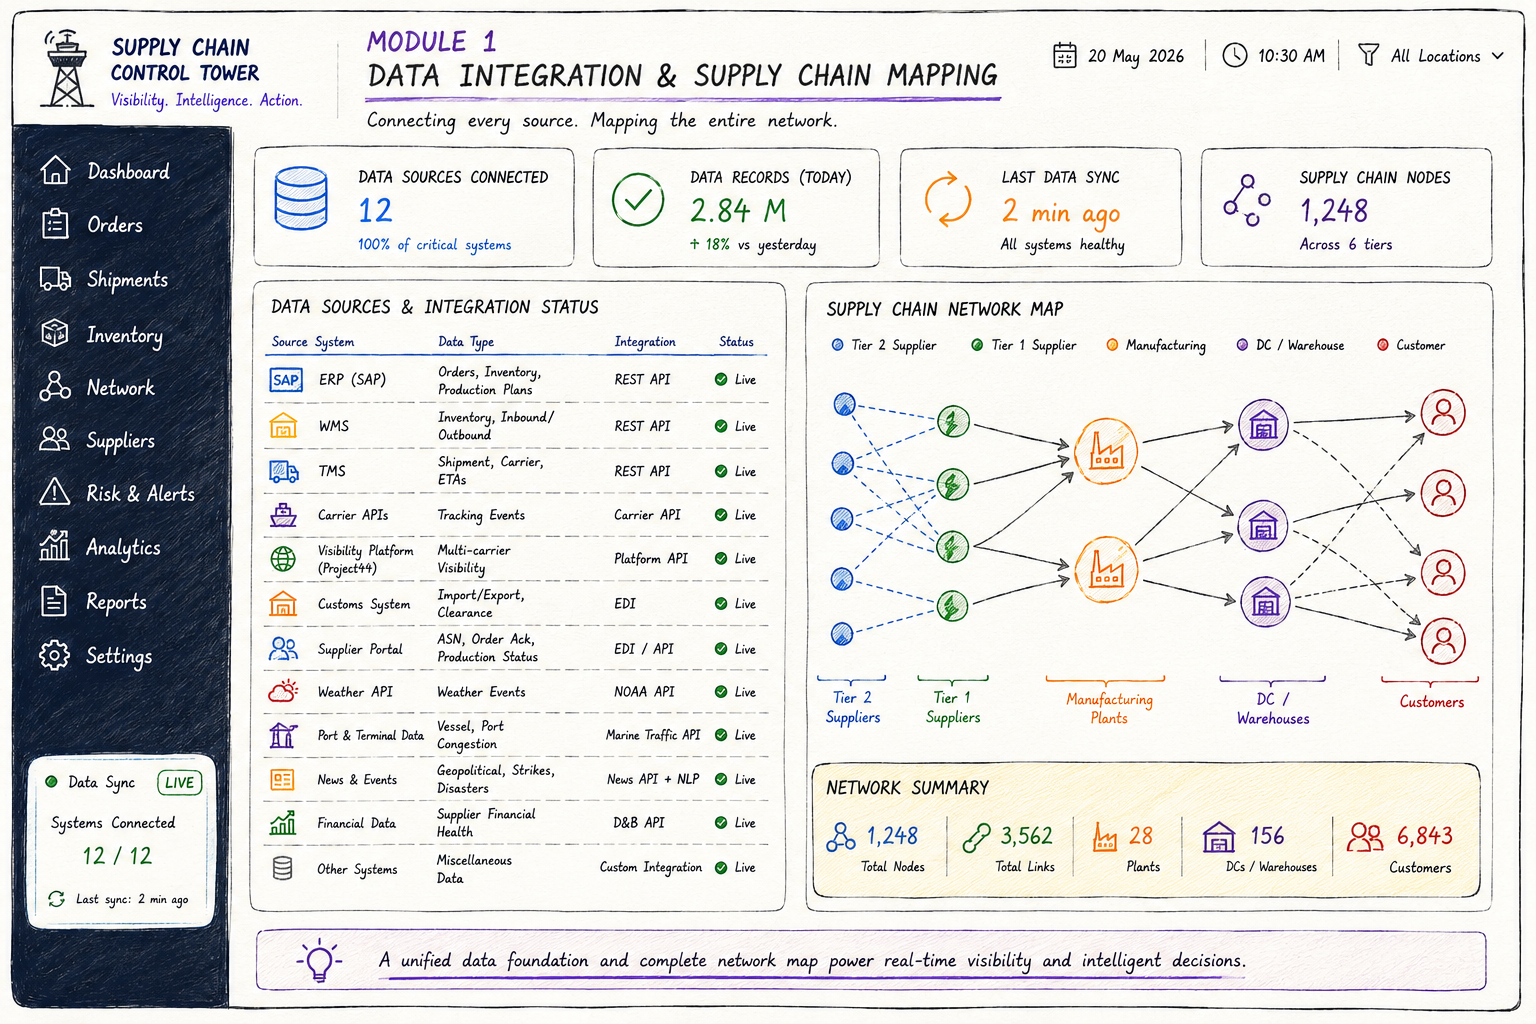
The control tower is only as useful as the data feeding it. The first engineering challenge is integrating data from every system that touches the supply chain, ERPs, WMS platforms, TMS platforms, carrier APIs, supplier portals, customs systems, and financial systems, into a single, normalised data model.
Data sources and integration methods:
| Data Source | What It Provides | Integration |
| ERP (SAP, Oracle, NetSuite) | Purchase orders, sales orders, inventory management, production plans | REST API, BAPI, EDI |
| WMS | Inventory positions by location, inbound and outbound activity | REST API |
| TMS | Shipment status, carrier assignments, ETAs | REST API |
| Carrier APIs (FedEx, UPS, Maersk) | Real-time tracking events | Carrier API |
| Visibility platforms (Project44, FourKites) | Multi-carrier telematics | Platform API |
| Customs systems | Import/export declarations, clearance status | EDI or API |
| Supplier portals | Order acknowledgements, ship notices, production status | EDI 856 ASN, API |
| Weather APIs | Weather events on supply chain routes | NOAA API, commercial weather |
| Port and terminal data | Vessel schedules, port congestion, berth availability | Marine Traffic API |
| News and events | Geopolitical events, strikes, natural disasters | News API + NLP |
| Financial data | Supplier financial health, credit ratings | D&B, credit bureau API |
The supply chain network map:
Before the control tower can provide intelligence, it needs to know the structure of the supply chain, which suppliers supply which materials to which plants, which plants produce which finished goods, which distribution centres serve which customer regions.
This network map is the topology on which all visibility and intelligence is overlaid.
The network map is built from the ERP data (purchase orders and sales orders define supplier and customer relationships) supplemented by manual configuration for relationships that do not appear in transactional data (strategic supplier relationships, backup supplier agreements, contract manufacturing arrangements).
The unified order view:
The control tower aggregates every open order, purchase orders to suppliers, transfer orders between facilities, customer sales orders, into a single view with real-time status.
| Order Type | Status Tracked | Source System |
| Purchase order | Acknowledged / In production / Ready to ship / Shipped / In transit / At customs / Delivered | Supplier portal + TMS + customs |
| Transfer order | Picked / Packed / In transit / Received | WMS + TMS |
| Sales order | Confirmed / Allocated / Picked / Shipped / Delivered | ERP + TMS |
| Production order | Scheduled / In process / Completed / Staged | ERP + MES |
Network inventory visibility:
| Location | Inventory Data | Refresh Frequency |
| Supplier warehouses | On-order and in-production quantities | Daily (from supplier portal) |
| In-transit | Goods on the way to receiving facility | Real-time (from TMS/carrier APIs) |
| Distribution centres | On-hand, reserved, available-to-promise | Real-time (from WMS) |
| In-transit to customer | Out for delivery | Real-time (from carrier APIs) |
| Customer locations | Consignment stock, VMI inventory | Daily (from customer EDI) |
The inventory health score:
For each SKU at each network node, the control tower calculates an inventory health score, days of supply remaining at current consumption rate. SKUs approaching stockout are colour-coded red. SKUs with excess inventory tying up working capital are flagged yellow.
This score, updated in real time, tells the supply chain team exactly where to focus attention without having to analyse raw inventory numbers.
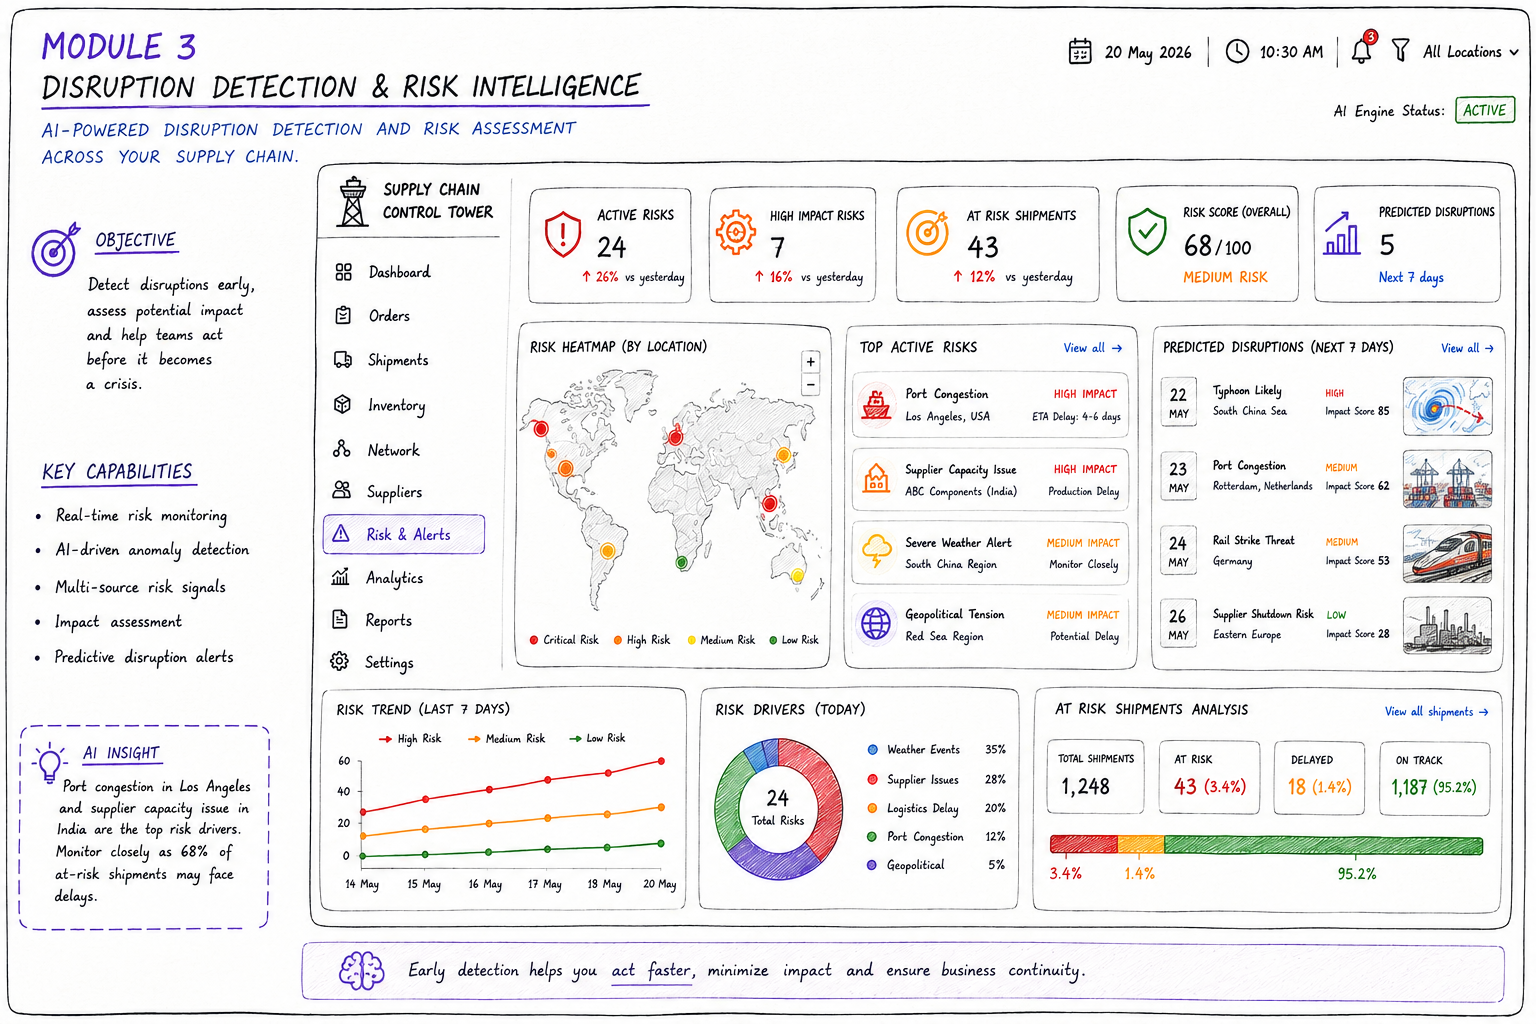
This is the most crucial module in the Supply chain control tower development process that transforms a visibility platform into a control tower. Visibility tells you what is happening in your supply chain today. Disruption detection tells you what events in the world are about to affect your supply chain, before the impact reaches you.
Disruption monitoring sources:
| Disruption Category | Sources | Lead Time Before Impact |
| Port congestion | Marine Traffic, port authority feeds, vessel AIS | 5–15 days |
| Weather events | NOAA, commercial weather services | 3–10 days |
| Labour actions (strikes) | News API + NLP, industry news | 1–14 days |
| Geopolitical events | News API, OFAC sanctions lists | Immediate to 30 days |
| Supplier financial stress | D&B financial health scores, news | 30–90 days |
| Natural disasters | USGS, weather APIs, disaster monitoring | 0–7 days |
| Regulatory changes | Government API, news | Variable |
| Pandemic/health events | WHO, CDC, government feeds | Variable |
The supplier impact analysis:
When a disruption event is detected, the control tower immediately determines which suppliers, orders, and inventory positions are at risk:
The supplier risk score:
Every supplier in the network receives a composite risk score updated monthly, combining financial health, operational reliability, geographic risk, and compliance status.
| Risk Dimension | Data Source | Weight |
| Financial health | D&B Paydex, credit rating, revenue trend | 25% |
| On-time delivery performance | Historical PO delivery data | 25% |
| Quality performance | Incoming inspection rejection rates | 20% |
| Geographic concentration risk | Country risk index, political stability | 15% |
| Cyber security posture | SecurityScorecard | 10% |
| Compliance status | Supplier audit results, certifications | 5% |
The supply chain concentration analysis:
For each critical component or material, the control tower calculates sourcing concentration, what percentage of supply comes from a single supplier or a single geography. A component sourced 100% from one supplier in one country is maximum concentration risk.
The control tower flags high-concentration, high-criticality combinations as strategic vulnerabilities requiring dual-sourcing or buffer stock strategies.
The exception engine:
The control tower does not surface every deviation, that would create alert fatigue. It surfaces deviations that are above threshold significance and routes them to the right person with the right context.
| Exception Type | Threshold | Routed To | Priority |
| Shipment at risk of late arrival | ETA > delivery commitment by 2+ days | Account manager + logistics planner | High |
| PO not acknowledged by supplier | 48 hours post-PO issue | Buyer | Medium |
| Inventory below safety stock | < 7 days of supply at current consumption | Planner | High |
| Supplier risk score deteriorated | Score dropped > 15 points in 30 days | Procurement manager | Medium |
| Disruption event affecting network | Detected event impacting 3+ POs | Supply chain director | High |
| Lead time increase detected | Actual lead time > contracted + 20% | Buyer | Medium |
Automated response workflows:
For high-frequency, well-defined exception types, the control tower can automate the response:
When inventory drops below safety stock for an auto-replenishment item, the system automatically generates a purchase order to the pre-approved supplier at the contracted quantity and sends it to the supplier. The buyer receives a notification that the PO was auto-generated and approves with one click.
When a shipment is delayed and will miss a customer delivery commitment, the system automatically sends a proactive delay notification to the customer with the revised ETA, logs the delay in the carrier’s scorecard, and generates a follow-up task for the account manager.
Strategic analytics views:
| Analytics View | Business Question |
| Lead time trend by supplier and lane | Are lead times improving or worsening? Where? |
| Cost per unit by supplier | Which supplier is most cost-efficient at total landed cost? |
| On-time delivery by supplier and lane | Which suppliers and lanes have the highest variability? |
| Inventory turns by product and location | Are we carrying too much stock anywhere? |
| Demand vs supply gap forecast | Where will we run short in the next 30/60/90 days? |
| AT-risk value by disruption scenario | If scenario X occurs, what is the financial impact? |
| Network resilience score | How vulnerable is the supply chain to common disruption types? |
Demand-supply matching:
The control tower overlays demand forecasts (from the ERP or demand planning system) against supply visibility (current inventory + in-transit + on-order) to identify gap scenarios: where demand will exceed supply in the next 30 to 90 days, and where supply will significantly exceed demand (excess inventory risk).
| Module | Cost Range (USD) | Notes |
| Data integration hub (10 source integrations) | $15K – $28K | ERP, WMS, TMS, carrier APIs, supplier portal |
| Supply chain network map + topology | $8K – $15K | Configuration + ongoing maintenance |
| Real-time order + inventory visibility | $10K – $18K | |
| Disruption detection engine + news NLP | $10K – $20K | Multi-source monitoring + impact analysis |
| Supplier risk scoring engine | $8K – $15K | D&B + SecurityScorecard + internal data |
| Exception management + alerting | $6K – $12K | Threshold rules + routing |
| Automated response workflows | $8K – $15K | |
| Analytics and intelligence dashboard | $8K – $15K | |
| Demand-supply gap forecasting | $8K – $15K | ML forecasting integration |
| Mobile app for supply chain managers | $6K – $12K | |
| AWS + VAPT + Year 1 ops | $6K – $12K | |
| Total | $93K – $177K | Full supply chain control tower |
EngineerBabu built enterprise operations management for Adani Group and supply chain intelligence for Simba Beer. CMMI Level 5. Google AI Accelerator 2024 Top 20. Contact: mayank@engineerbabu.com
Supply chain visibility software tracks what is currently happening in your supply chain, where shipments are, what inventory you have, which orders are open. A supply chain control tower does this and adds three additional layers: intelligence (AI-driven detection of anomalies and disruption events before they impact operations), analytics (historical pattern analysis, risk scoring, scenario modelling), and action (recommended responses, automated workflows, decision support). The distinction is that visibility software requires a human analyst to look at the data and figure out what is wrong. A control tower proactively surfaces what is wrong, quantifies the impact, and presents response options. For supply chains with hundreds of suppliers, thousands of SKUs, and global logistics networks, the difference between reactive visibility and proactive intelligence determines whether disruptions are caught in time to mitigate or after they have already caused customer impact.
Multi-tier supply chain visibility extends monitoring beyond direct (tier-1) suppliers to include tier-2 suppliers (suppliers’ suppliers) and tier-3 suppliers (their suppliers), providing end-to-end network transparency. Before COVID, most enterprises had visibility only into their tier-1 suppliers. The pandemic revealed that the most impactful disruptions originated at tier-2 and tier-3 levels, a semiconductor fab (tier-3 supplier) shutting down cascaded into tier-2 electronics component shortages, then into tier-1 automotive part shortages, then into finished vehicle production halts worldwide. Multi-tier visibility requires suppliers to share their own supply chain data through supplier portals or EDI integrations, combined with third-party data on geographic risk, port congestion, and supplier financial health to infer tier-2 and tier-3 exposure without requiring every small supplier to integrate directly.
A supply chain control tower uses AI in three ways for disruption detection. First, it monitors external signals, port congestion data, weather events, news, geopolitical events, supplier financial health changes, and uses NLP to identify events that affect supply chain nodes in the network. Second, it applies a supplier impact analysis that maps each detected event to the specific POs, suppliers, and production schedules it will affect, calculating estimated delay and financial impact automatically. Third, it uses ML anomaly detection on operational data, supplier lead times trending longer than contracted, carrier on-time rates dropping below threshold, inventory turns slowing in specific nodes, to identify internal disruption signals before they become crises. The combination of external event monitoring and internal anomaly detection gives supply chain planners 5 to 14 days of advance warning on most disruptions, enough time to activate alternative suppliers, expedite critical orders, or adjust customer commitments proactively.