How to Build a Smart Meter Data Management Platform, AMI Integration, Billing, Tamper Detection, and Energy Analytics 2026


Create engaging, high-performance mobile applications tailored to your business needs. We craft future-ready apps that offer smooth user experiences on all devices.
Build robust and scalable websites and CMS platforms that help you manage content effortlessly. Our development ensures a seamless digital presence.
Launch secure, feature-rich online stores with intuitive shopping experiences. We build tailored eCommerce platforms designed for growth.
Design captivating games with immersive gameplay and stunning graphics. From concept to launch, we build engaging experiences that players love.
Enhance your customer relationships with customized Salesforce implementations. Drive growth and efficiency with smarter CRM solutions.
Harness artificial intelligence and machine learning to automate workflows and gain actionable insights. Our AI transforms data into smart decisions.
Accelerate your software delivery lifecycle with continuous integration, delivery, and infrastructure automation to boost efficiency.
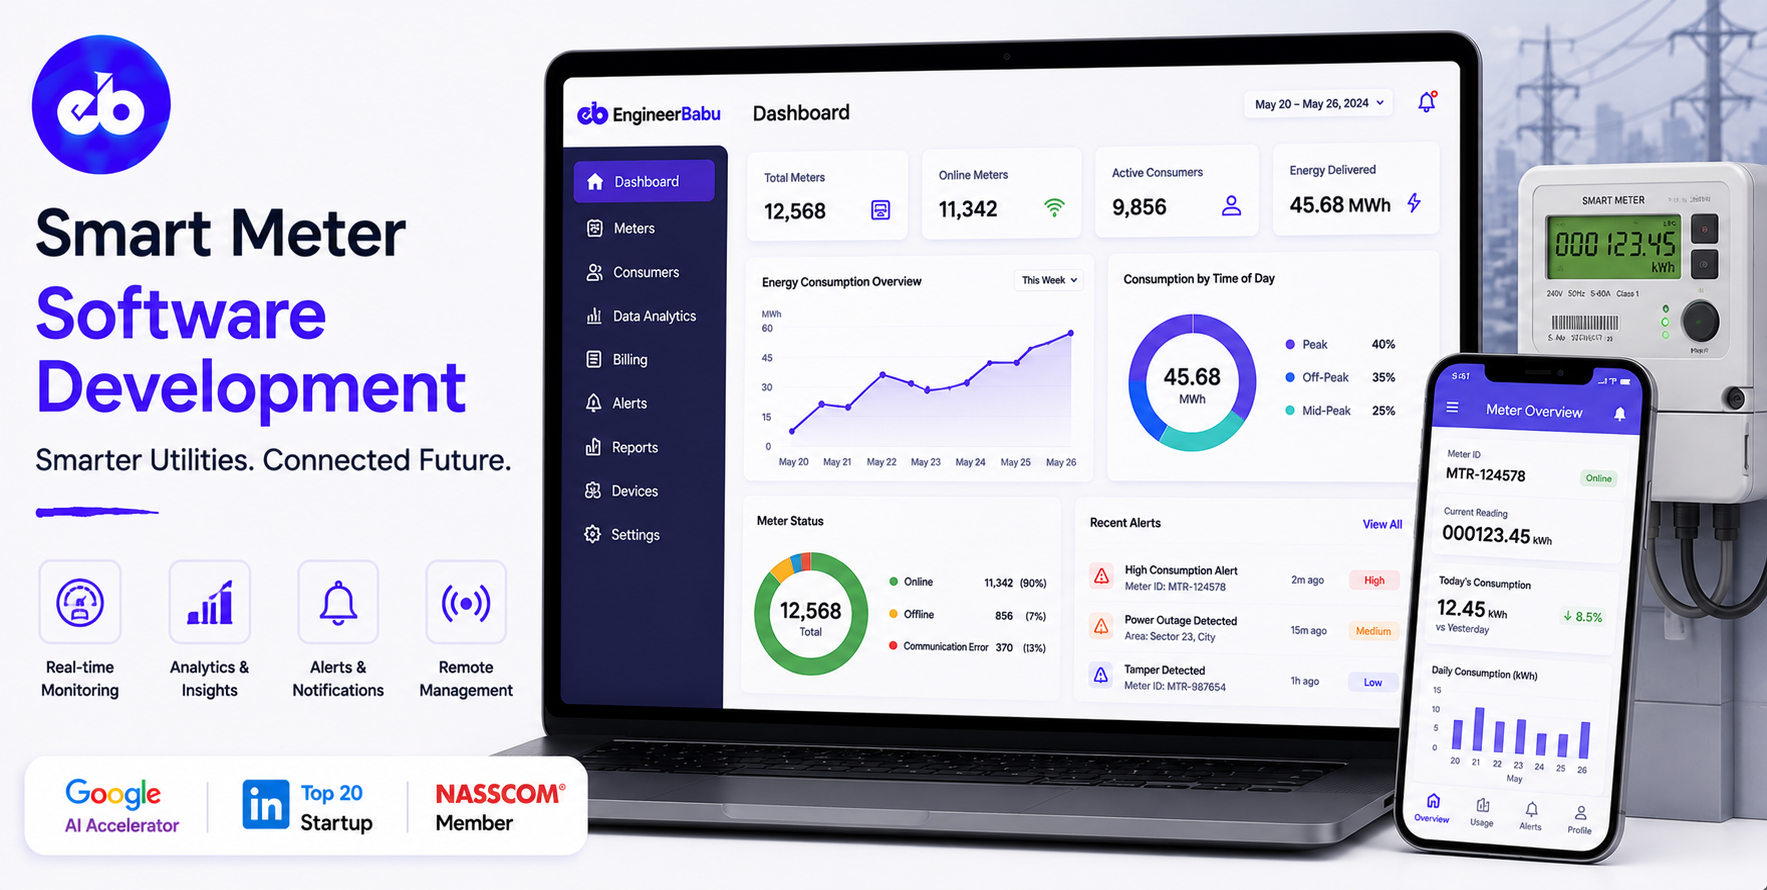
India’s National Smart Grid Mission has mandated smart meter installation for all consumers above 200 units/month, covering 250 million meters by 2026. The hardware rollout is underway. The software problem is far less solved.
Most DISCOMs (Distribution Companies) are receiving smart meter data into systems that were built for monthly manual reads, not for 15-minute interval data from millions of endpoints simultaneously.
A smart meter data management platform is not a billing system with a different data source. It is a high-throughput IoT data ingestion engine, a time-series analytics platform, a tamper detection intelligence layer, and a consumer-facing energy management portal, all in one.
The utility that builds this correctly cuts AT&C (Aggregate Technical and Commercial) losses, reduces billing disputes, and gives consumers the visibility that reduces complaints.
EngineerBabu built enterprise technology for Adani Group, one of India’s largest power distribution and infrastructure conglomerates. CMMI Level 5. Google AI Accelerator 2024 Top 20. Contact: mayank@engineerbabu.com
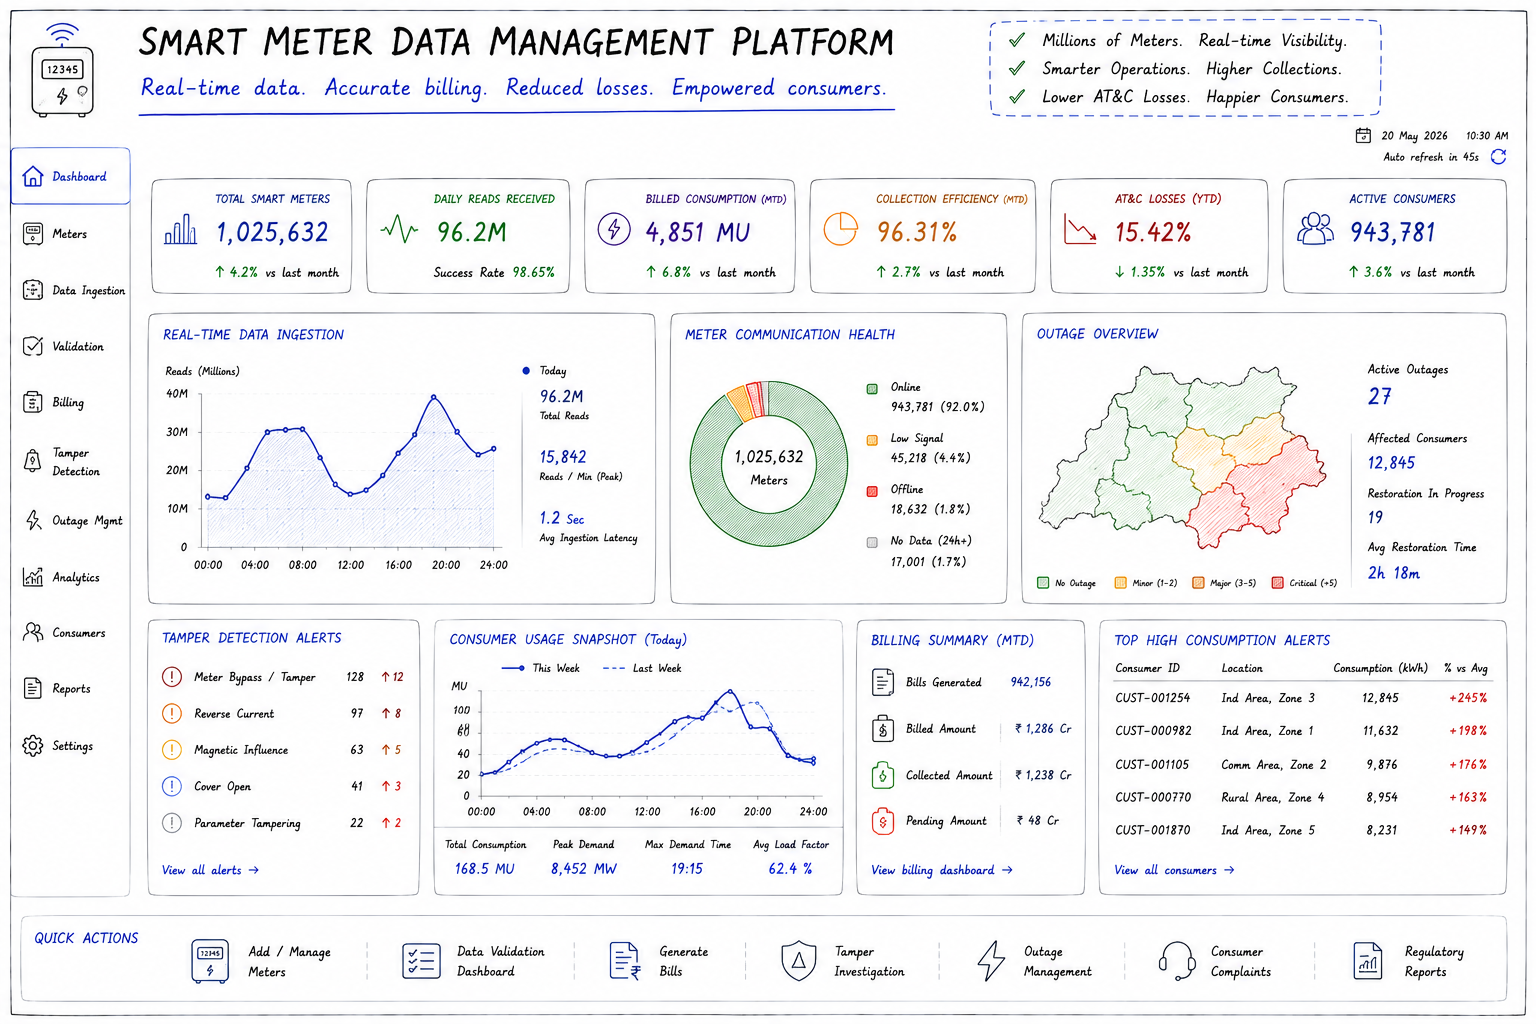
| Function | Platform Module |
| AMI data ingestion | Receive 15-minute interval reads from millions of meters |
| Meter management | Meter registry, installation records, firmware management |
| Data validation and estimation | Detect and fill missing or erroneous reads |
| Billing engine | Generate accurate bills from interval data |
| Tamper detection | Identify meter bypass, reverse current, and load manipulation |
| Consumer portal | Self-service energy usage, bills, complaints |
| Outage management | Detect last gasp events, map outage zones |
| Energy analytics | Load forecasting, peak demand, loss analysis |
| Revenue protection | AT&C loss tracking, high-consumption alerts |
| Regulatory reporting | Regulatory compliance reports for CERC/SERC |
The AMI (Advanced Metering Infrastructure) communication architecture:
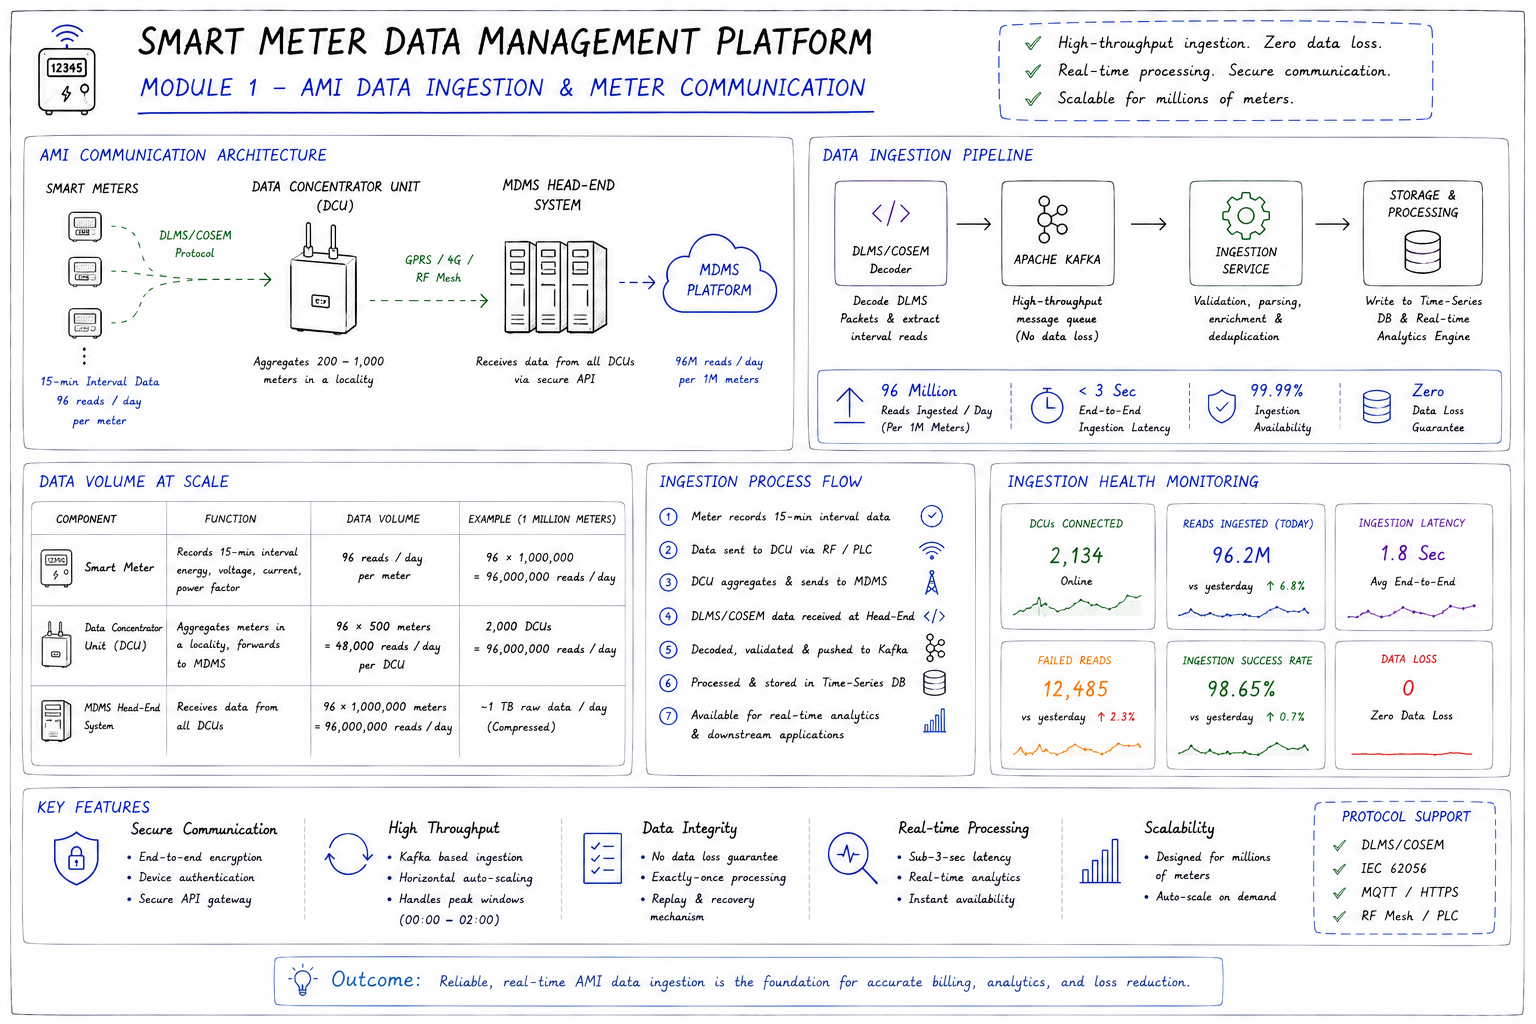
Smart meters do not communicate directly to the cloud. They communicate to a neighbourhood-level data concentrator unit (DCU) which aggregates reads from 200 to 1,000 meters and forwards them to the MDMS (Meter Data Management System) via GPRS, 4G, or RF mesh.
| Component | Function | Data Volume |
| Smart meter | Records 15-minute interval energy, voltage, current, power factor | 96 reads/day per meter |
| Data Concentrator Unit (DCU) | Aggregates meters in a locality, forwards to MDMS | 96 × 500 meters = 48,000 reads/day per DCU |
| MDMS Head-End System | Receives data from all DCUs | 96 × 1,000,000 meters = 96,000,000 reads/day per million meters |
At 1 million smart meters, a mid-size DISCOM, the platform receives 96 million data points every 24 hours. The ingestion architecture must handle this without data loss and with consistent latency.
The ingestion architecture:
Raw meter data arrives in DLMS/COSEM protocol (the international smart meter communication standard). The head-end system decodes the DLMS packets, extracts the interval reads, and pushes them to the MDMS via a secure API.
The MDMS ingestion pipeline uses Apache Kafka as the message queue, handling the high-throughput, high-availability requirement of millions of simultaneous reads without losing a single data point during peak communication windows (typically 00:00 to 02:00 when meters synchronise).
From Kafka, the data flows to the time-series database and to the real-time analytics engine simultaneously.
Smart meters fail. Communication links drop. A meter may miss 3 to 5% of its interval reads in any given month. A billing engine that calculates bills only on actual reads will either under-bill (if missing reads are treated as zero) or create disputes (if missing reads block billing).
The data validation rules:
| Validation Check | What It Detects | Action |
| Range check | Reading below 0 or above meter’s maximum capacity | Flag as erroneous, replace with estimation |
| Rate of change check | Consumption jump impossible in 15 minutes | Flag as erroneous |
| Missing read detection | No data received for expected interval | Flag as missing, trigger estimation |
| Voltage/current consistency | Energy inconsistent with measured voltage and current | Flag for tamper investigation |
| Duplicate read | Same timestamp received twice | De-duplicate |
| Stuck meter | Same reading for multiple consecutive intervals | Flag for field inspection |
The estimation engine:
Missing reads are estimated using one of three methods depending on data availability:
Profile-based estimation, the meter’s typical consumption pattern for the same time slot on the same day type (weekday/weekend) from the last 4 weeks. Linear interpolation, the read before and after the gap are averaged to fill missing intervals. Historical average, for extended gaps, the meter’s historical average consumption for the period is used.
All estimated reads are flagged in the database as estimated rather than actual. Bills generated using estimated reads are flagged as estimated bills. When actual reads are eventually received, from a field visit or meter firmware update, the bill is revised and the difference is applied to the next cycle.
The interval-to-bill calculation:
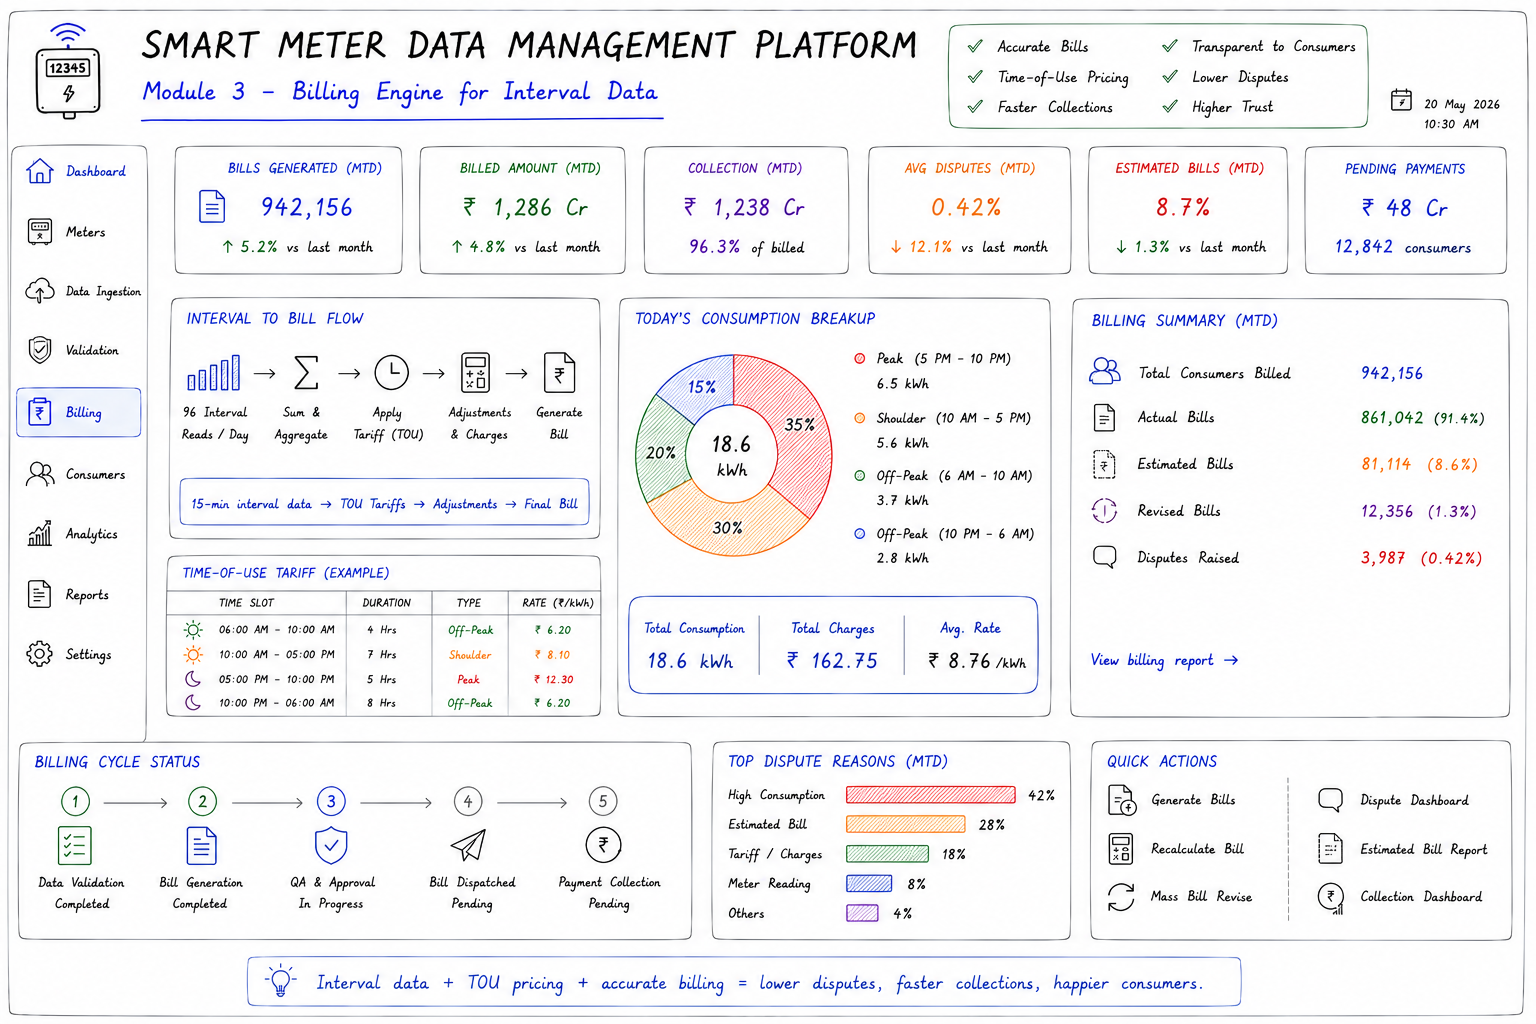
A traditional billing engine reads the meter once per month, the difference between this month’s reading and last month’s reading is the consumption. A smart meter billing engine reads 96 interval values per day and must:
Sum interval values to produce total consumption for the billing period. Apply time-of-use (TOU) tariff rates, peak, off-peak, and shoulder, based on which time slot each interval falls in.
Apply slab-based tariff, the first 100 units at Rate 1, the next 200 units at Rate 2, units above 300 at Rate 3. Calculate fixed charges, energy charges, taxes, and levies. Apply net metering credits if the consumer has a solar installation and exported energy.
Tariff complexity the engine must handle:
| Tariff Type | Description | Calculation |
| Flat tariff | Single rate for all consumption | Consumption × rate |
| Slab tariff | Progressively higher rates for higher consumption | Slab-wise calculation |
| TOU tariff | Different rates by time of day | Each interval billed at its time slot rate |
| Demand charge | Charge based on peak demand in the billing period | Maximum 15-min demand × demand rate |
| Fixed charge | Monthly charge regardless of consumption | Fixed per connection or per kW of sanctioned load |
| Net metering | Export energy credited against import | Net consumption = import − export |
| TOD tariff | Time of Day, more granular than TOU | 6 or more rate periods per day |
AT&C (Aggregate Technical and Commercial) losses in Indian distribution range from 15% to 40% in many states. A significant portion is commercial loss, energy consumed but not billed due to meter tampering, illegal connections, or billing fraud. Smart meter data enables automated tamper detection that manual meter reading can never achieve.
Tamper detection signals from smart meter data:
| Signal | Tamper Type | Detection Method |
| Current imbalance | Meter bypass, current flowing but not measured | Neutral current significantly different from phase current |
| Reverse energy flow without solar | Reverse connection to reduce meter reading | Negative import readings without registered DG/solar |
| Meter cover opening event | Physical access to tamper with meter | Event log from meter, cover open flag |
| Magnetic interference | External magnet to slow or stop disc | Event flag from meter + abnormal reading pattern |
| Consumption below baseline | Significant drop after historical consistency | ML model, consumption drops >40% vs similar consumers |
| Load curve anomaly | Abnormal consumption pattern vs peer group | ML model, pattern inconsistent with meter category |
| Communication loss + low consumption | Meter communication deliberately disrupted | Correlation of comm loss with consumption drop |
The tamper intelligence engine:
Individual signals can be explained by legitimate causes, a factory going on holiday reduces consumption. The tamper engine looks for combinations of signals: cover open event + consumption drop + current imbalance at the same meter within the same period.
This combination has a very high probability of actual tampering and triggers a field inspection alert.
A smart meter generates 96 data points per day per consumer. For most consumers, this data is invisible. The consumer portal makes it visible, and in doing so, reduces consumption, reduces complaints, and builds the trust that reduces electricity theft (a significant portion of which is driven by consumers who do not trust their bills).
Consumer portal features:
| Feature | Details |
| Real-time consumption | Current power draw in watts, updates every 15 minutes |
| Daily usage graph | 96-interval bar chart for any selected day |
| Monthly usage trend | Current month vs last month vs same month last year |
| Bill breakdown | How the current bill was calculated, slabs, TOU rates, levies |
| Payment history | Past bills, payment dates, outstanding balance |
| Online payment | UPI, NEFT, debit card, payment to DISCOM account |
| Complaint registration | Self-service complaint with tracking number |
| Appliance-level estimation | “Your air conditioner accounts for approximately 40% of your bill” |
| Budget alerts | Alert when monthly consumption approaches a set threshold |
| Solar generation tracking | For net metering consumers, export and credit tracking |
Last gasp events:
When a smart meter loses power, due to an outage or deliberate disconnection, it sends a “last gasp” message to the MDMS before its internal battery dies. This event tells the MDMS exactly when power was lost at that consumer point.
When hundreds of meters in the same feeder send last gasp events within seconds of each other, the MDMS detects an outage event.
It maps the affected meters on the grid topology, identifies the likely fault location based on which upstream equipment is shared by all affected meters, and alerts the field team to the specific distribution transformer or feeder section that has tripped.
This automated outage detection typically reduces Mean Time To Repair (MTTR) by 30 to 50%, because the field team is dispatched to the correct location immediately rather than after consumer calls are aggregated and analysed manually.
| Module | Cost Range (USD) | Notes |
| AMI head-end integration + DLMS protocol parser | $10K – $20K | DLMS/COSEM protocol expertise required |
| Kafka-based ingestion pipeline | $8K – $15K | High-throughput, million-meter scale |
| Time-series database setup | $6K – $12K | InfluxDB or AWS Timestream |
| Data validation + estimation engine | $8K – $15K | Missing read handling |
| Interval-based billing engine | $12K – $22K | Most complex module, tariff combinations |
| Tamper detection engine | $10K – $20K | ML models + event correlation |
| Consumer portal (web development + mobile app) | $8K – $15K | Real-time consumption, bill, payment |
| Outage detection + grid topology | $8K – $15K | Last gasp processing, fault location |
| Energy analytics dashboard (DISCOM) | $6K – $12K | Loss analysis, load forecasting |
| Regulatory reporting module | $5K – $10K | CERC/SERC formats |
| AWS + VAPT + Year 1 ops | $6K – $12K | |
| Total | $87K – $168K | Full MDMS platform |
EngineerBabu built enterprise technology for Adani Group, one of India’s largest power distribution operators. CMMI Level 5. Google AI Accelerator 2024 Top 20. Contact: mayank@engineerbabu.com
DLMS (Device Language Message Specification) and COSEM (Companion Specification for Energy Metering) are the international standards that define how smart meters communicate their data. A smart meter stores readings, events, and parameters as structured objects, each with a defined class and attribute number in the COSEM object model. DLMS defines the protocol for reading and writing these objects over various communication channels. Every smart meter manufacturer globally, Genus, Secure, Landis+Gyr, Honeywell, implements DLMS/COSEM in their meters, making it the universal language of smart metering. A meter data management system that does not implement a DLMS parser cannot receive or decode the data from smart meters, making DLMS support a fundamental technical requirement, not an optional feature.
Smart meter tamper detection uses three layers of intelligence. First, hardware event flags, modern smart meters record specific events when tamper-indicative actions occur: meter cover opened, magnetic field detected, reverse current detected, terminal cover opened, or meter earth disconnected. These events are transmitted to the MDMS with a timestamp. Second, consumption anomaly detection, ML models trained on each consumer’s historical usage pattern flag when current consumption deviates significantly from expected levels. A commercial consumer whose consumption drops 60% without any registered change in business operations is flagged for investigation. Third, signal correlation, the tamper engine correlates multiple weak signals that individually have innocent explanations. A cover open event plus consumption drop plus current imbalance in the same period at the same meter creates a high-confidence tamper alert that triggers a field inspection.
AT&C (Aggregate Technical and Commercial) loss is the percentage of energy units input into the distribution network that is not recovered as revenue. It includes technical losses (energy lost as heat in transmission lines and transformers), commercial losses (energy consumed but not billed due to tampering or billing errors), and collection inefficiency (energy billed but not collected). Smart metering addresses commercial losses directly, by detecting tampered meters, identifying unbilled connections through consumption anomaly detection, and enabling accurate billing from actual interval reads rather than estimated reads that can be manipulated. DISCOMs with full smart meter coverage typically report 8 to 15 percentage point reductions in AT&C losses within two to three years of deployment. At large DISCOM scale, each percentage point of AT&C reduction represents crores of rupees in recovered revenue.