How to Build a Vehicle Inspection Platform, AI Damage Detection, Inspection Workflow, Report Generation, and Fleet Integration 2026


Create engaging, high-performance mobile applications tailored to your business needs. We craft future-ready apps that offer smooth user experiences on all devices.
Build robust and scalable websites and CMS platforms that help you manage content effortlessly. Our development ensures a seamless digital presence.
Launch secure, feature-rich online stores with intuitive shopping experiences. We build tailored eCommerce platforms designed for growth.
Design captivating games with immersive gameplay and stunning graphics. From concept to launch, we build engaging experiences that players love.
Enhance your customer relationships with customized Salesforce implementations. Drive growth and efficiency with smarter CRM solutions.
Harness artificial intelligence and machine learning to automate workflows and gain actionable insights. Our AI transforms data into smart decisions.
Accelerate your software delivery lifecycle with continuous integration, delivery, and infrastructure automation to boost efficiency.
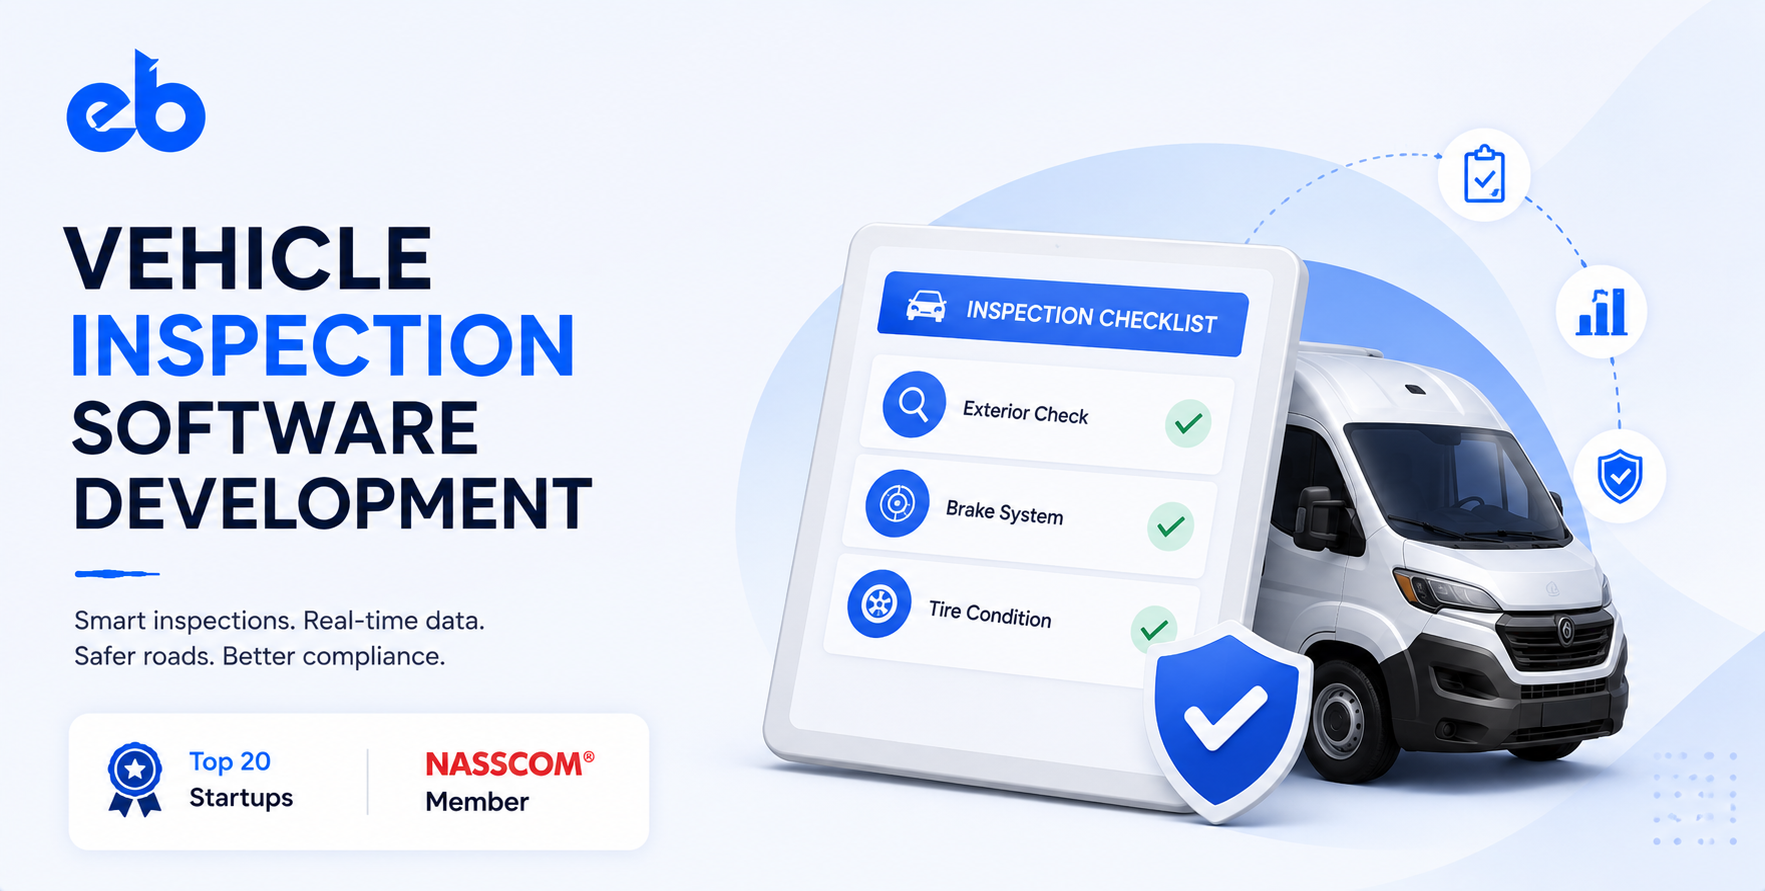
Vehicle inspection is a $6.2 billion industry in the US alone, covering insurance claims assessment, used car pre-purchase inspection, fleet maintenance checks, rental car damage assessment, and regulatory roadworthiness testing.
Most of it is still done with clipboards and manual photo labelling, an inspector walks around the vehicle, notes damage, takes photos, and types up a report that takes 45 to 90 minutes to complete.
AI computer vision changes every part of this. A trained damage detection model can scan a vehicle’s exterior photos, identify every visible defect, scratch, dent, crack, broken glass, missing part, paint damage, classify each defect by severity, and generate a structured damage report in under 60 seconds.
The inspector’s job shifts from documentation to quality review.
The use cases are broad: insurance motor claims (AI-first FNOL), used car platform pre-listing inspection, fleet return damage assessment, car rental pre- and post-rental check, warranty claim validation, and government vehicle fitness certification.
EngineerBabu, Google AI Accelerator 2024 Top 20, builds AI vision systems. CMMI Level 5. 75+ YC-backed companies. Contact: mayank@engineerbabu.com
| Function | Module |
| Photo capture workflow | Guided photo capture, mandatory angles and close-ups |
| AI damage detection | Computer vision model, damage identification and classification |
| Damage annotation | Annotated damage overlays on vehicle photos |
| Mechanical inspection | Structured checklist for mechanical and functional checks |
| OBD-II diagnostics | Fault code reading from the vehicle’s OBD port |
| Valuation integration | Repair cost estimate from damage findings |
| Inspection report | Branded PDF report with photos, annotations, findings |
| Digital workflow | Inspection assignment, status tracking, review |
| Fleet integration | Fleet management system integration for scheduled inspections |
| Insurance integration | FNOL submission, claim status, insurer API |
| Analytics | Inspection trends, common damage types, inspector performance |
Why guided capture matters:
A damage detection AI model is only as good as the photos it receives. A photo taken from the wrong angle, in poor lighting, or too far from the damage will either miss the defect or produce a false positive.
The guided capture workflow ensures every inspection produces photos that the AI model can reliably process.
The mandatory photo set:
| Photo Number | Angle | Purpose |
| 1 | Front 45° (driver side) | Front bumper, headlights, hood |
| 2 | Front 45° (passenger side) | Same, opposite angle |
| 3 | Driver side profile | Full side panel |
| 4 | Passenger side profile | Full side panel |
| 5 | Rear 45° (driver side) | Rear bumper, taillights, trunk |
| 6 | Rear 45° (passenger side) | Same, opposite angle |
| 7 | Roof | Roof panel, sunroof if present |
| 8 | Dashboard / Odometer | Mileage, warning lights |
| 9 | Interior (driver side) | Seat condition, door panel |
| 10 | Interior (passenger side) | Same |
| 11–20 | Close-up damage photos | Inspector-added for any visible damage |
The capture guidance UX:
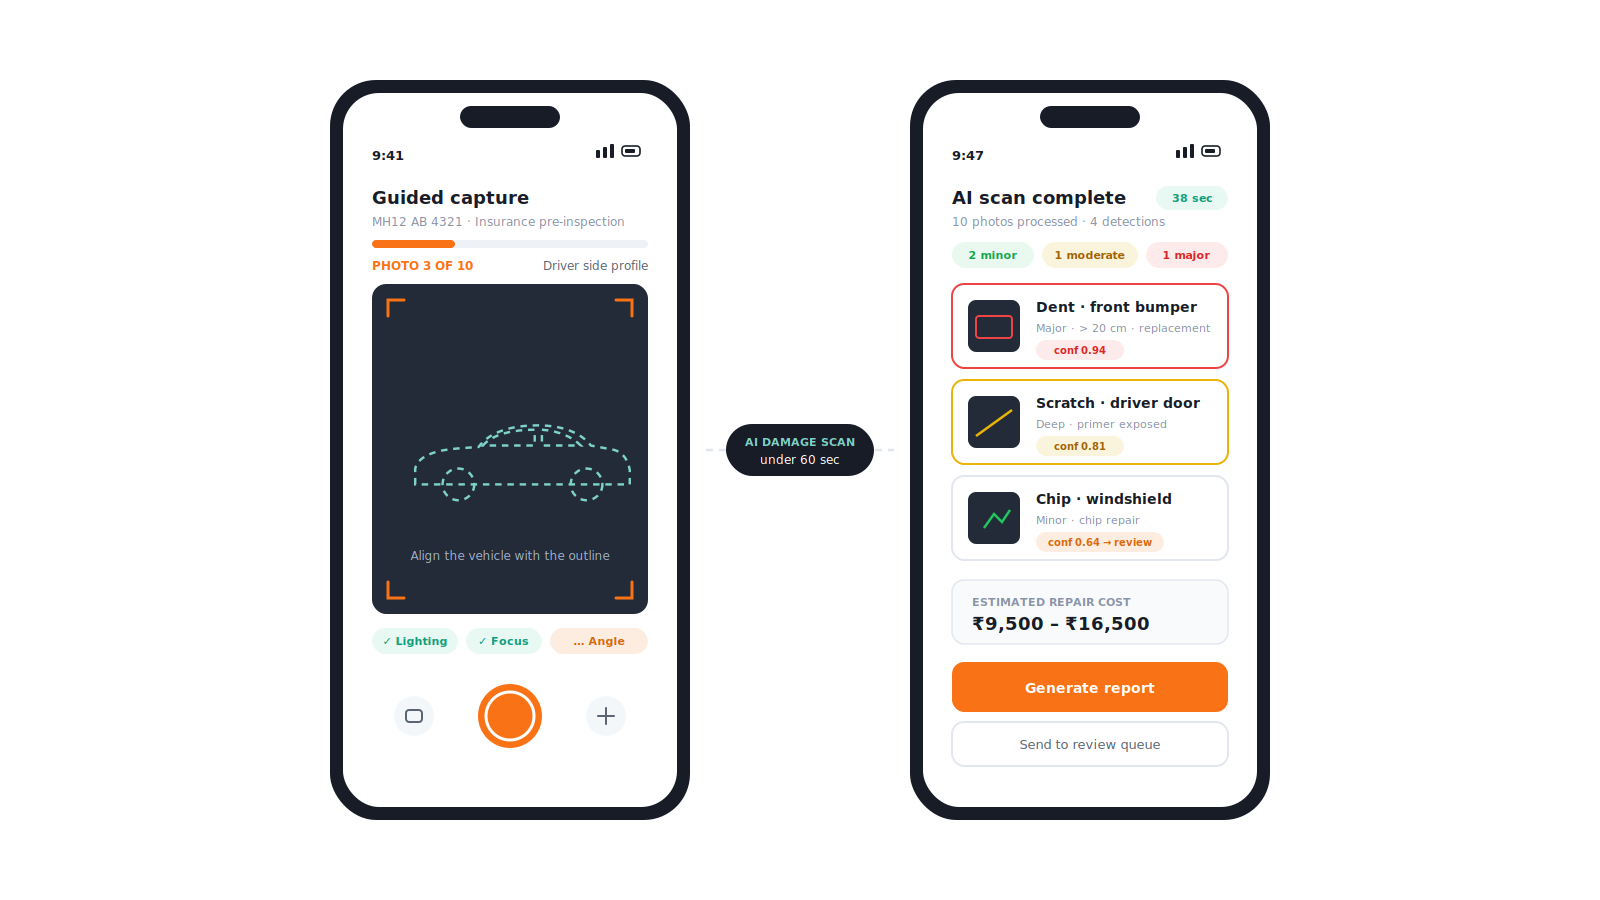
The mobile app shows an outline guide for each mandatory photo, a ghost overlay of where the vehicle should be positioned in the frame.
The app validates each capture using a lightweight on-device model that checks: is a vehicle in the frame, is the angle approximately correct, is the image adequately lit, is it in focus? Photos that fail these checks prompt an immediate retake before the inspector moves to the next angle.
The damage detection model architecture:
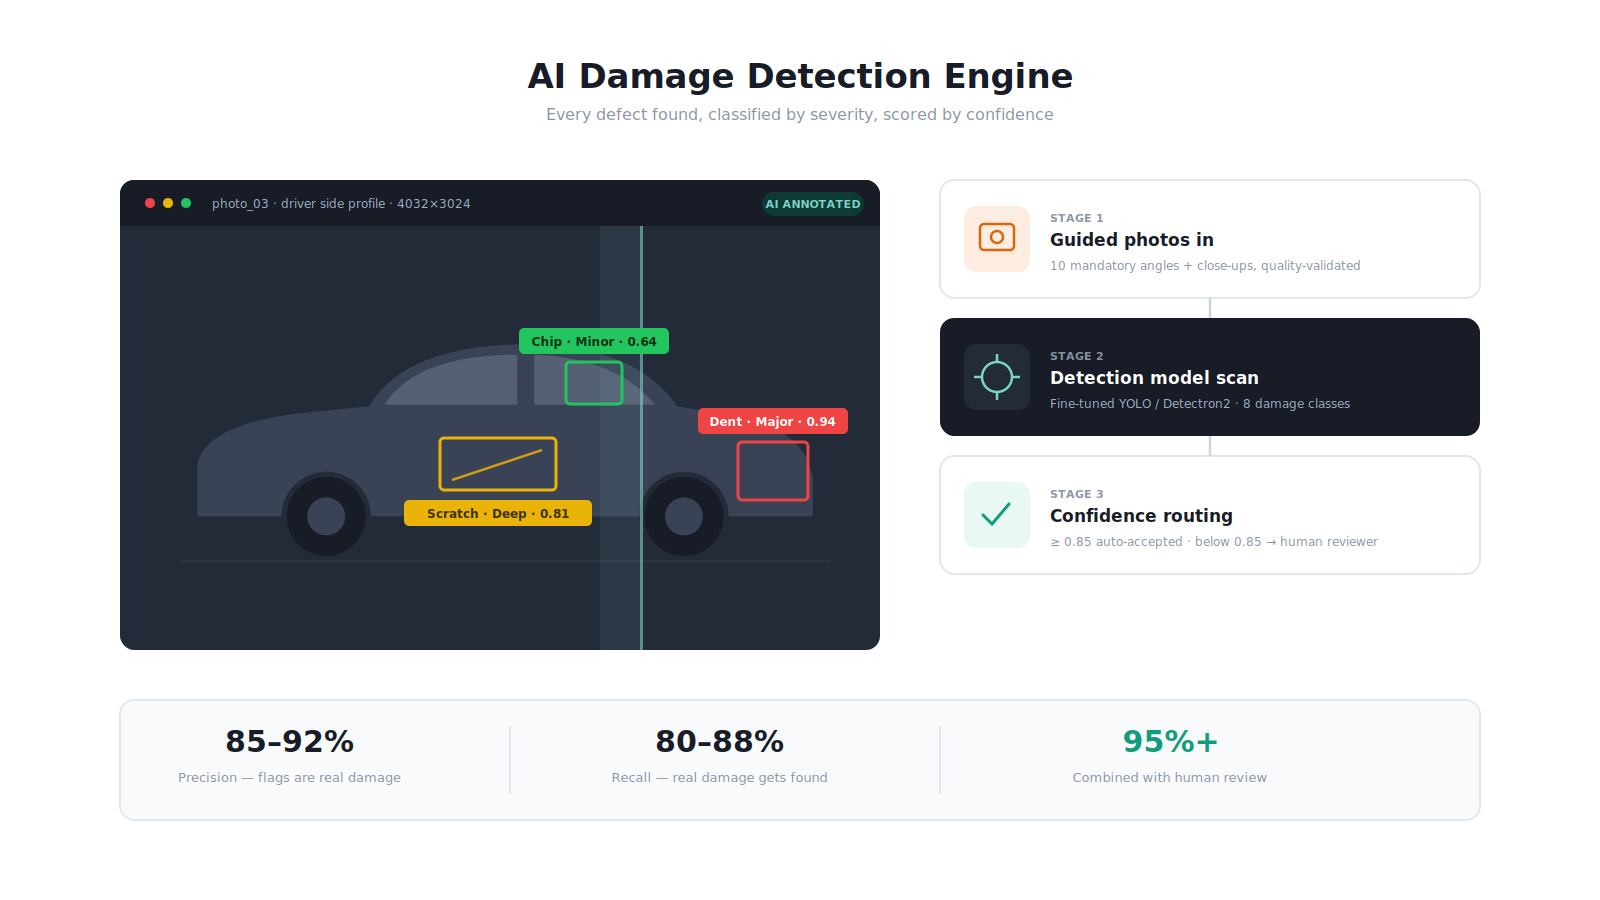
The AI model is a fine-tuned object detection model, based on a YOLO or Detectron2 architecture, trained on a large dataset of annotated vehicle damage images.
What the model detects and classifies:
| Damage Category | Severity Levels | Detection Approach |
| Dent | Minor (< 5cm) / Moderate (5–20cm) / Major (> 20cm) | Object detection + size estimation |
| Scratch | Surface (paint only) / Deep (primer exposed) / Panel replacement needed | Pixel analysis + depth inference |
| Crack (glass) | Chip / Crack / Shatter | Object detection |
| Paint damage | Fading / Oxidation / Peeling | Segmentation model |
| Missing part | Missing mirror, trim, spoiler | Reference comparison |
| Structural damage | Crumple zone, frame damage | Object detection + severity scoring |
| Rust | Surface rust / Structural rust | Segmentation |
| Tire damage | Flat / Bulge / Worn tread | Object detection |
The training dataset:
A production-grade vehicle damage detection model requires 100,000 to 500,000 annotated damage images, each photo labelled with bounding boxes around each damage instance and severity classification. Building this dataset requires:
Either access to an existing labelled dataset (insurance companies, car marketplace platforms are the best sources), or a human annotation pipeline that labels the inspection photos collected as the platform operates.
Confidence scoring and human review routing:
Every detection has a confidence score (0 to 1). High-confidence detections are accepted automatically. Low-confidence detections, where the model is uncertain, are routed to a human reviewer who confirms or rejects the annotation. This human-in-the-loop approach maintains accuracy while reducing manual review load to only genuinely uncertain cases.
The structured mechanical checklist:
AI damage detection covers visible exterior damage. Mechanical condition requires a structured inspector-completed checklist:
| System | Inspection Points |
| Engine | Start behaviour, warning lights, oil level, coolant level, belt condition |
| Transmission | Gear shifting smoothness, clutch condition (manual), CVT behaviour |
| Brakes | Brake pad condition, brake fluid, handbrake effectiveness |
| Suspension | Bounce test, steering play, unusual noises on bump |
| Tyres | Tread depth measurement, sidewall condition, spare tyre |
| Lights | All exterior lights functional, dashboard warning lights |
| AC / Heater | Cooling performance, heating performance, compressor noise |
| Windshield wipers | Blade condition, washer fluid |
| Electrical | Power windows, power locks, central locking, infotainment |
| Documentation | RC book, insurance, PUC certificate, service history |
The OBD-II diagnostic scan:
For the most comprehensive mechanical assessment, the inspector connects an OBD-II Bluetooth scanner to the vehicle’s diagnostic port. The mobile app reads stored fault codes (DTCs, Diagnostic Trouble Codes) from all vehicle systems, engine, transmission, ABS, airbag, emissions, and maps them against a fault code database to produce plain-language descriptions of any detected issues.
The annotated damage overlay:
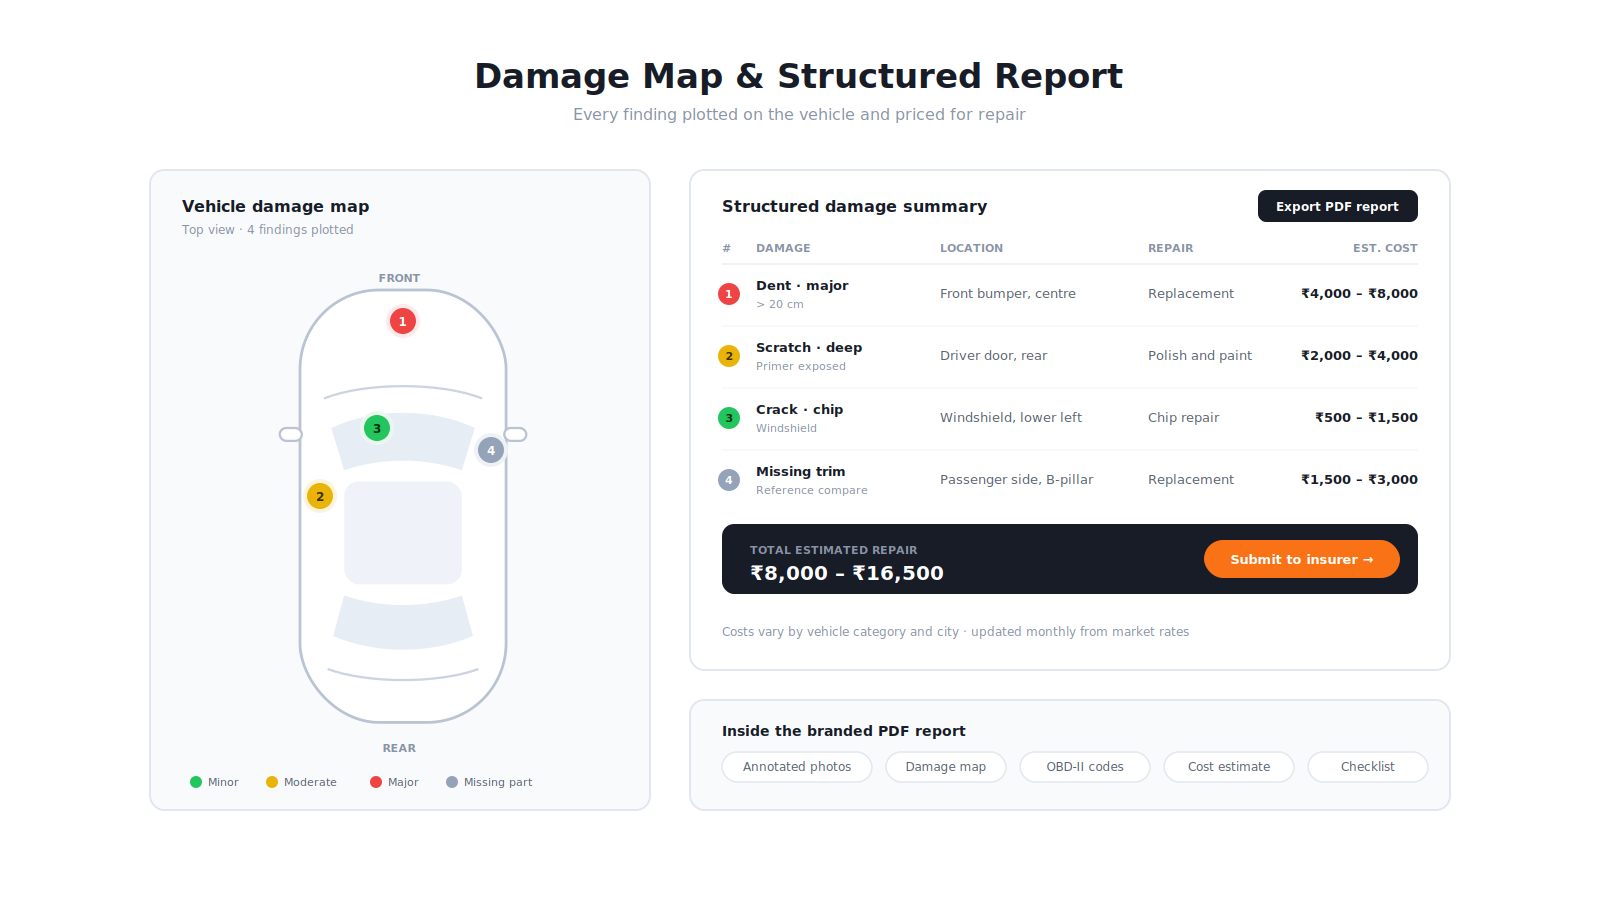
After the AI model processes the photos, the platform generates an annotated version of each photo, bounding boxes around each detected damage instance, colour-coded by severity (green for minor, yellow for moderate, red for major), with a label showing the damage type and severity.
The vehicle damage map:
In addition to annotated photos, the report includes a 2D vehicle diagram, a top-down schematic of the vehicle, with each detected damage location plotted on it. This damage map gives the reader an immediate visual summary of damage distribution across the vehicle.
The structured damage summary:
| Damage | Location | Severity | Repair Type | Estimated Cost |
| Dent | Front bumper, centre | Moderate | PDR or replacement | ₹4,000 – ₹8,000 |
| Scratch | Driver door, rear | Surface | Polish and paint | ₹2,000 – ₹4,000 |
| Crack | Windshield, chip | Minor | Chip repair | ₹500 – ₹1,500 |
| Missing trim | Passenger side, B-pillar | — | Replacement | ₹1,500 – ₹3,000 |
The repair cost database:
Every damage type maps to a repair cost range, maintained by the platform and updated monthly from market rates. Cost varies by vehicle category (hatchback vs SUV vs luxury), repair type (PDR vs panel beating vs replacement), and market location (metro vs Tier 2 city).
The insurer integration:
For insurance use cases, the platform submits the damage assessment and cost estimate to the insurer’s API in the format required for FNOL (First Notification of Loss) processing.
The insurer’s system receives: vehicle details, damage photos with annotations, damage summary, and repair cost estimate, everything needed to move to claims approval without a separate surveyor visit for straightforward cases.
The scheduled inspection programme:
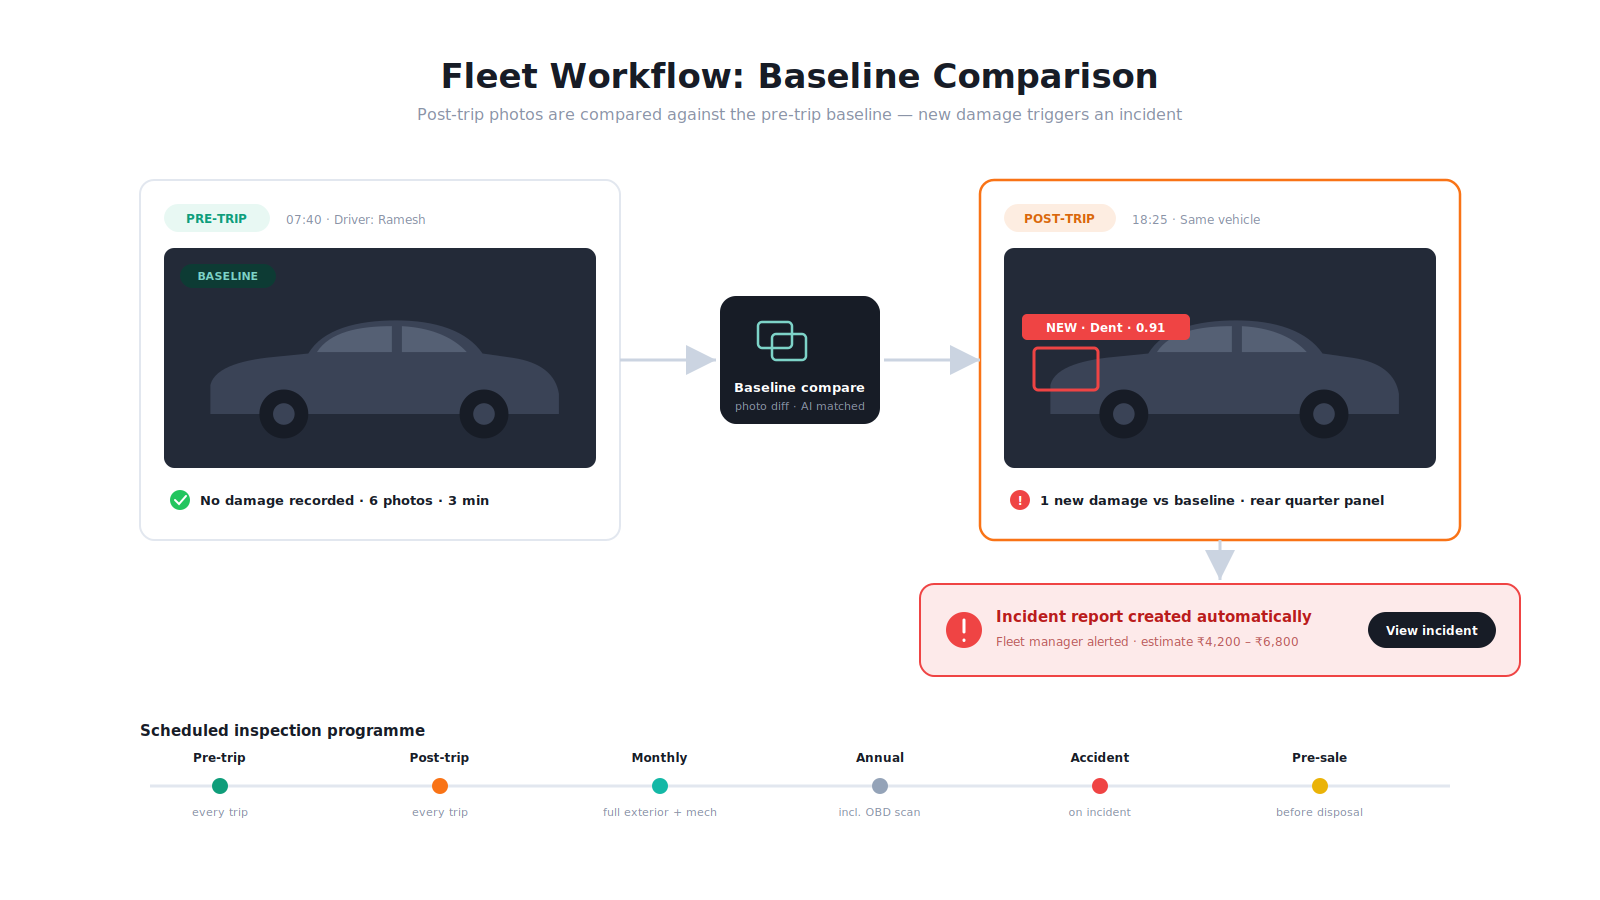
For fleet operators, companies managing 50 to 5,000 vehicles, the platform manages a scheduled inspection programme:
| Trigger | Inspection Type | Frequency |
| Pre-trip | Driver checks lights, tyres, fluid levels | Before each trip |
| Post-trip | Driver reports any damage from the trip | After each trip |
| Monthly | Full exterior and mechanical inspection | Monthly |
| Annual | Comprehensive including OBD scan | Annually |
| Accident | Damage assessment after incident | After any incident |
| Pre-sale | Full inspection before vehicle disposal | Before sale |
The driver app, pre- and post-trip:
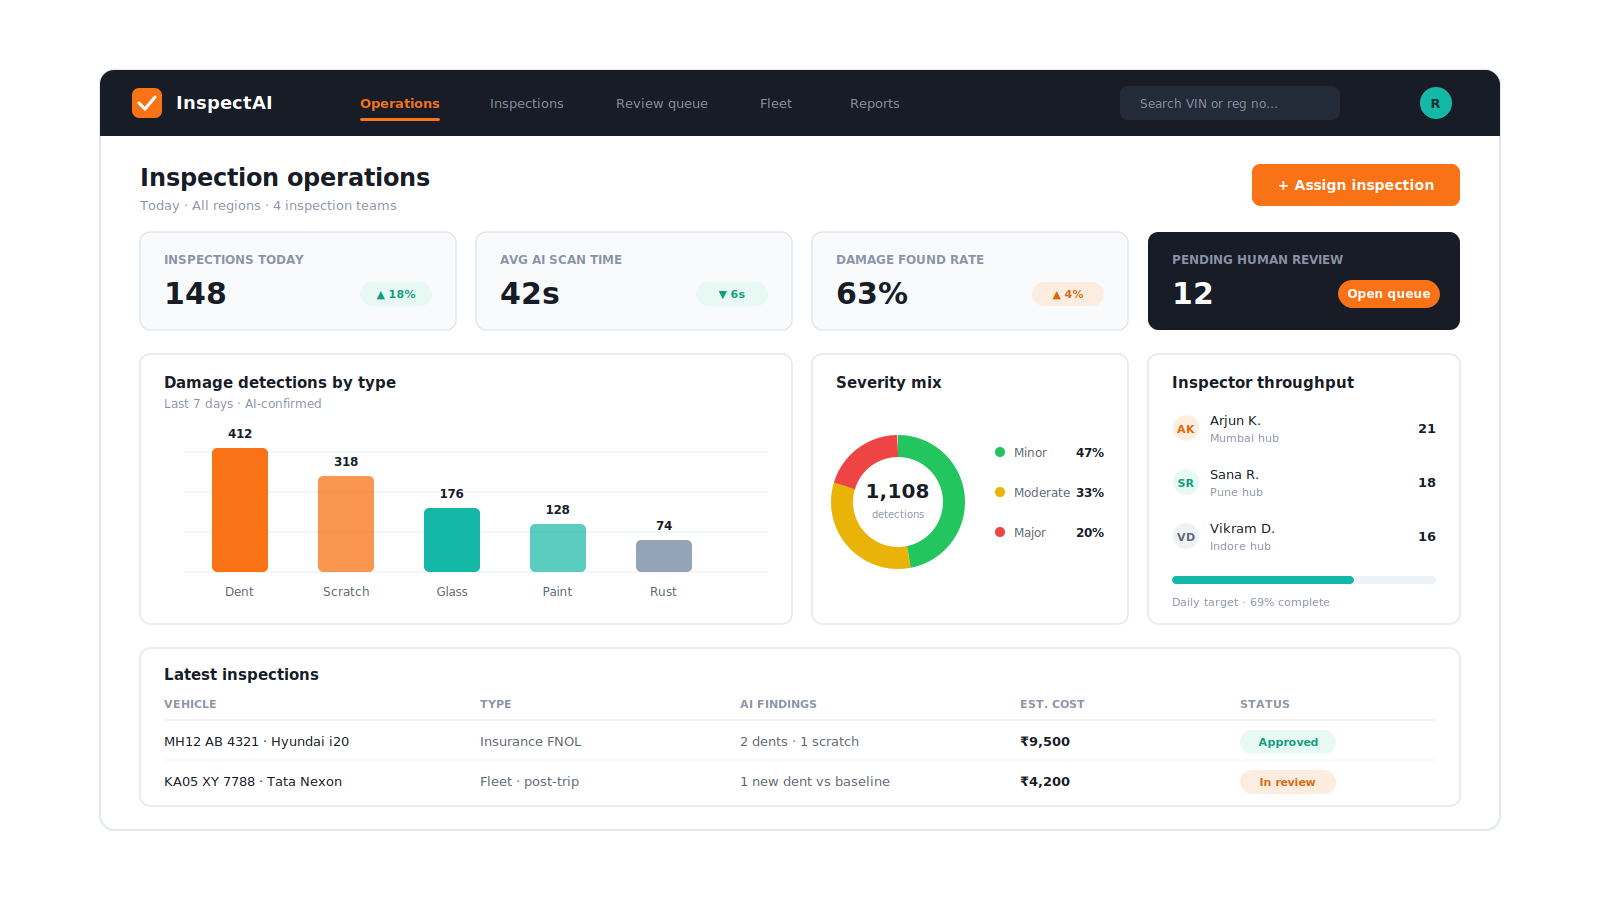
The driver app simplifies pre- and post-trip inspections to a guided photo capture + exception reporting flow, taking 3 to 5 minutes rather than the 20 to 30 minutes a traditional paper inspection takes.
Any new damage detected in the post-trip inspection compared to the pre-trip baseline triggers an incident report and fleet manager alert.
| Module | Cost Range (USD) | Notes |
| Guided photo capture app (iOS + Android app) | $10K – $18K | On-device quality validation |
| AI damage detection model (training + deployment) | $20K – $35K | Dataset curation + model training + API |
| Damage annotation overlay + vehicle map | $6K – $12K | |
| Mechanical inspection checklist | $4K – $8K | |
| OBD-II Bluetooth scanner integration | $5K – $10K | DTC database integration |
| Repair cost estimation engine | $6K – $12K | Cost database, vehicle category logic |
| Branded PDF report generation | $5K – $10K | |
| Insurance FNOL API integration | $6K – $12K | Per insurer |
| Fleet inspection scheduling + management | $8K – $15K | |
| Fleet manager dashboard | $5K – $10K | |
| Analytics + damage trend reporting | $4K – $8K | |
| AWS + VAPT + Year 1 ops | $5K – $10K | |
| Total | $84K – $160K | Full vehicle inspection platform |
EngineerBabu, Google AI Accelerator 2024 Top 20, builds AI computer vision systems. CMMI Level 5. Contact: mayank@engineerbabu.com
AI vehicle damage detection uses a convolutional neural network, typically a YOLO or Detectron2 architecture fine-tuned on a large dataset of annotated vehicle damage images, to identify damage instances in vehicle photos. The model is trained on photos where every damage instance has been manually labelled with a bounding box, damage type, and severity classification. In production, the model processes each incoming photo, identifies bounding box coordinates around each damage instance, classifies the damage type and severity, and returns a confidence score for each detection. Well-trained models on high-quality guided photo datasets achieve 85 to 92% precision (of what the model flags as damage, 85–92% is genuine damage) and 80 to 88% recall (of all genuine damage present, the model finds 80–88%). The human review workflow handles low-confidence detections, bringing effective accuracy above 95% when AI and human review are combined.
OBD-II (On-Board Diagnostics, second generation) is a standardised vehicle diagnostic interface mandatory for all vehicles sold in the US since 1996 and in India for BS6-compliant vehicles. Every vehicle has an OBD-II port, typically under the dashboard, that provides access to all stored diagnostic trouble codes (DTCs) from every electronic control unit in the vehicle: engine, transmission, ABS, airbag, emissions, and more. A Bluetooth OBD-II scanner connects to the port and transmits the stored fault codes to a mobile app. The inspection platform maps each DTC code to its description and severity using a comprehensive fault code database, converting raw codes like P0301 into plain language descriptions like “Engine Cylinder 1 Misfire Detected, requires immediate attention.” This transforms a visual and checklist inspection into a comprehensive assessment that catches hidden mechanical issues not visible to the inspector’s eye.
An insurance pre-inspection is a comprehensive one-time inspection documenting a vehicle’s complete condition at a specific point in time, typically before policy issuance or at the time of a claim. It requires the full mandatory photo set, AI damage detection across all photos, mechanical checklist completion, and a complete structured report with cost estimates. A fleet pre-trip inspection is a lightweight daily check, a driver completing a quick walkaround before taking a vehicle out, capturing a minimum photo set and flagging any obvious new damage or safety concern in under 5 minutes. The platform supports both by configuring inspection type templates, the insurance pre-inspection template requires 20 photos, full AI processing, and a complete report; the pre-trip template requires 6 photos and a basic status confirmation. The critical difference in the fleet context is baseline comparison, the post-trip photos are automatically compared against the pre-trip baseline to identify any new damage that occurred during the trip, generating an incident report for the fleet manager.