How to Build a Dark Store Management Platform, Hyperlocal Fulfillment, Picker App, Slot Management, and Delivery Intelligence 2026


Create engaging, high-performance mobile applications tailored to your business needs. We craft future-ready apps that offer smooth user experiences on all devices.
Build robust and scalable websites and CMS platforms that help you manage content effortlessly. Our development ensures a seamless digital presence.
Launch secure, feature-rich online stores with intuitive shopping experiences. We build tailored eCommerce platforms designed for growth.
Design captivating games with immersive gameplay and stunning graphics. From concept to launch, we build engaging experiences that players love.
Enhance your customer relationships with customized Salesforce implementations. Drive growth and efficiency with smarter CRM solutions.
Harness artificial intelligence and machine learning to automate workflows and gain actionable insights. Our AI transforms data into smart decisions.
Accelerate your software delivery lifecycle with continuous integration, delivery, and infrastructure automation to boost efficiency.
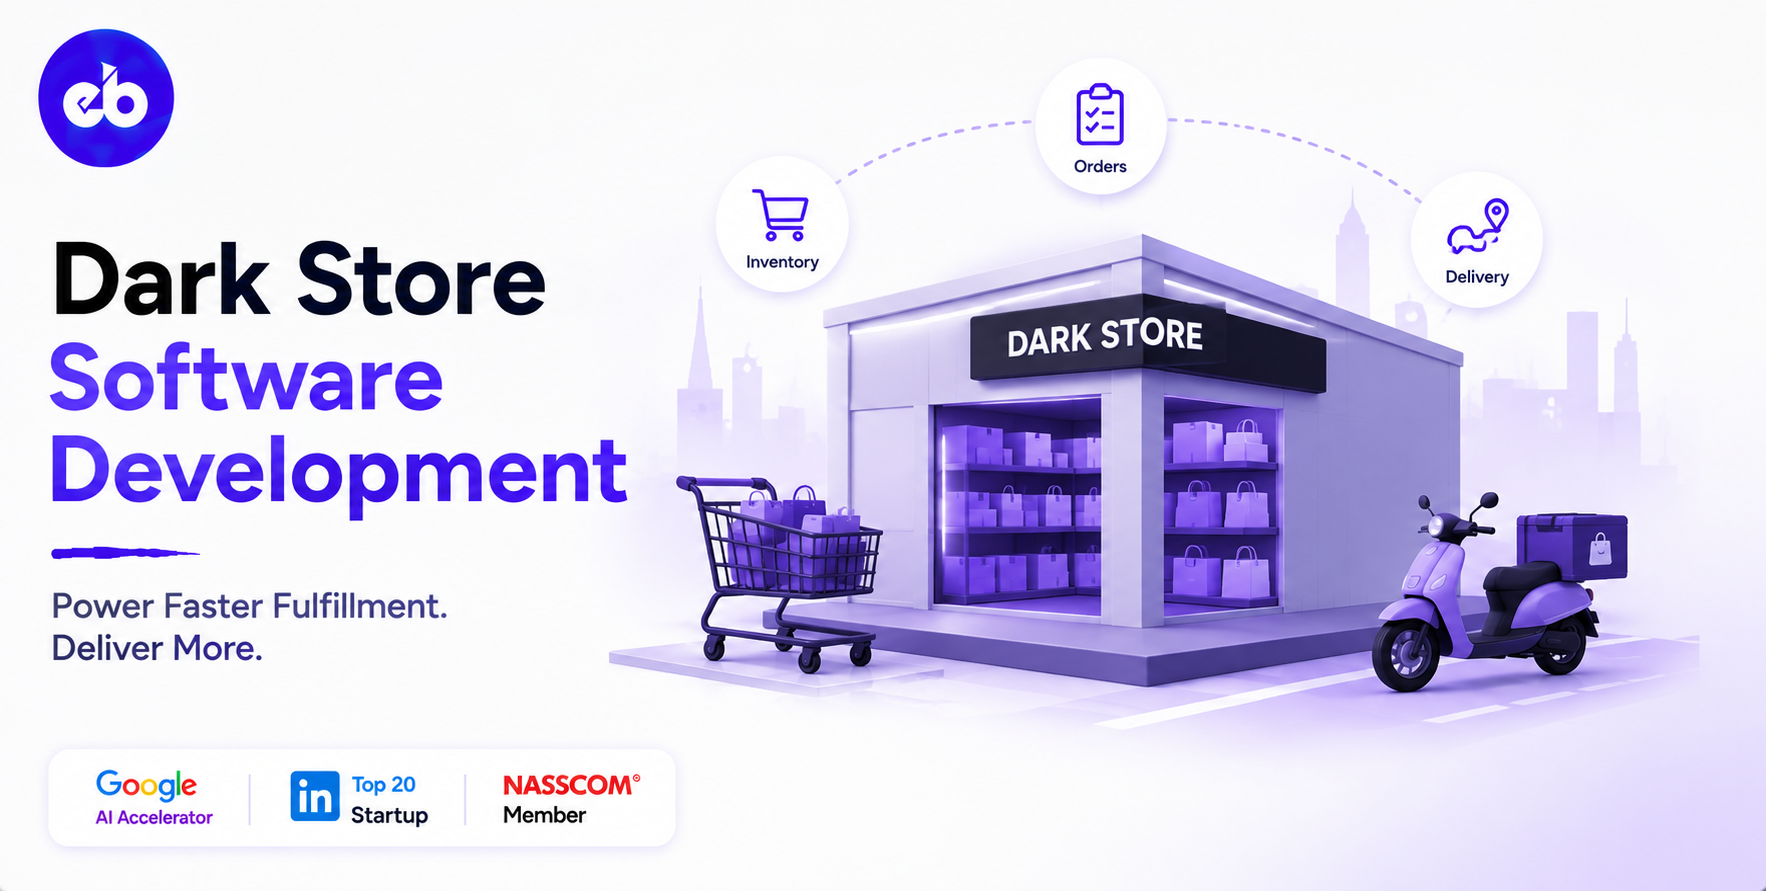
Quick commerce promised 10-minute delivery and the world was sceptical. Blinkit, Zepto, Swiggy Instamart, and BigBasket Now collectively proved it is not just possible, it is what 200 million urban Indians now expect for grocery and household essentials.
The unit economics of quick commerce depend entirely on one thing: how fast a dark store can pick, pack, and hand off an order to a delivery partner.
A dark store, a small-format fulfilment centre typically 2,000 to 5,000 square feet, optimised for speed rather than retail experience, is nothing like a traditional warehouse.
Every layout decision, every picking workflow, every inventory replenishment trigger is optimised for one metric: order-to-dispatch time. The platform that manages a dark store must understand this with the same clarity.
This guide covers how to build a dark store management platform, from the order processing engine through the picker app, slot management, live inventory, and the delivery allocation engine that connects every order to the nearest available rider within seconds.
EngineerBabu built logistics technology for Serman Logistics and technology for 75+ YC-backed companies, many in quick commerce and hyperlocal delivery. CMMI Level 5. Google AI Accelerator 2024 Top 20. Contact: mayank@engineerbabu.com
| Function | Module |
| Order intake and processing | Real-time order flow from app, OMS integration |
| Slot management | Delivery slot allocation, capacity management |
| Picking management | Pick queue, picker assignment, guided picking |
| Packing management | Pack station, weight check, label generation |
| Live inventory | Real-time stock, low stock alerts, auto-replenishment |
| Substitution management | Out-of-stock substitution logic |
| Delivery allocation | Rider assignment, route to customer |
| Store performance dashboard | Orders per hour, pick time, OFR, SLA compliance |
| Inventory management | GRN, putaway, cycle count, waste tracking |
| Store operations | Shift management, staff productivity |
| Analytics | Fill rate, OFR, SLA breach analysis, demand forecasting |
The order flow:
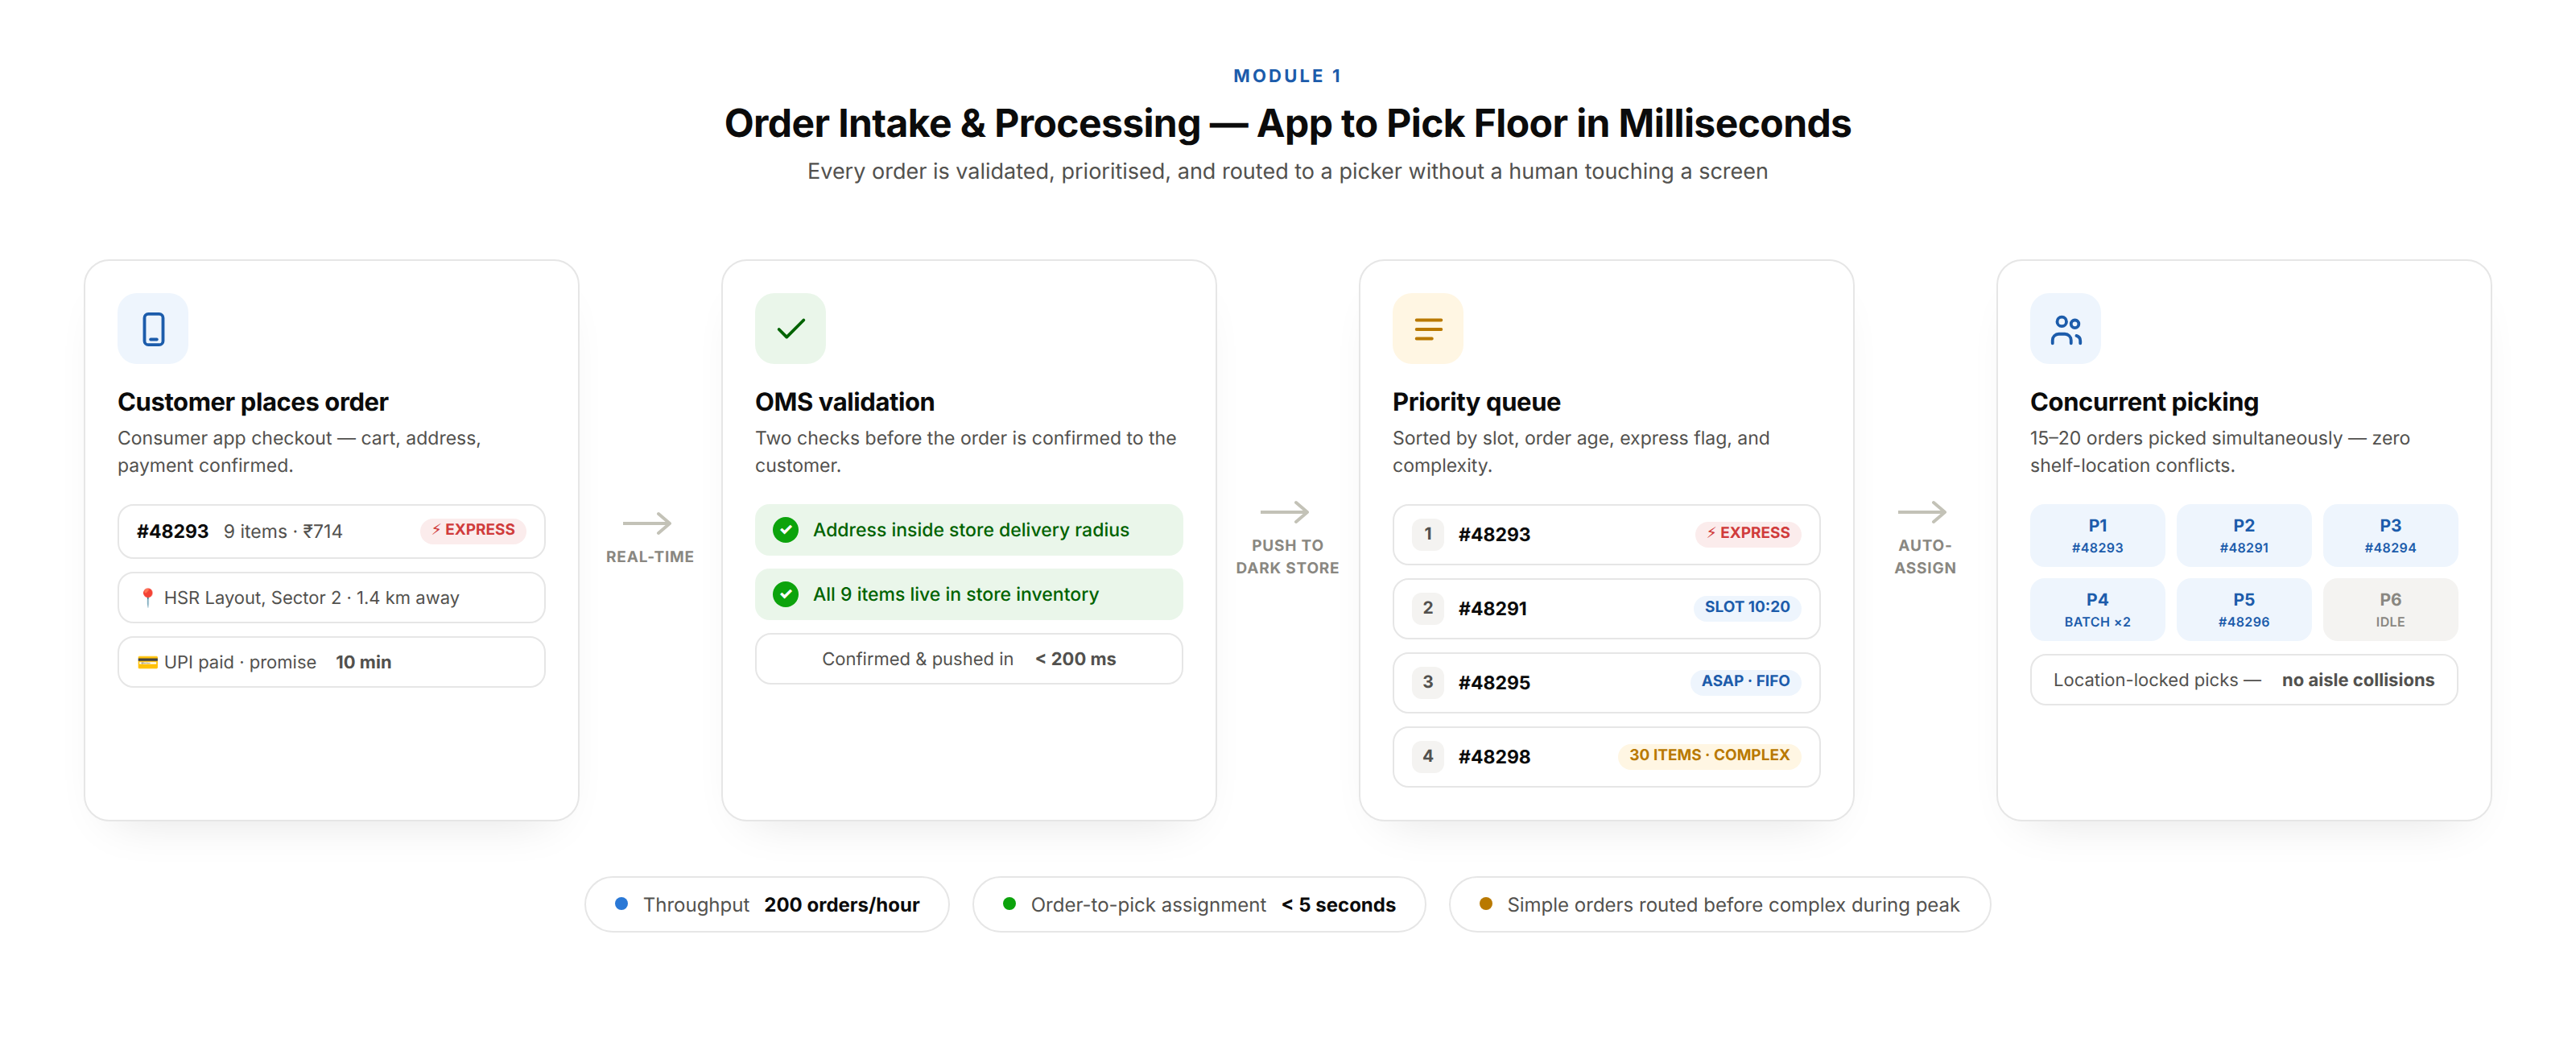
A customer orders from the consumer app. The order hits the OMS (Order Management System). The OMS checks if the customer’s location is within the dark store’s delivery radius and if the items are available.
If both conditions are met, the order is confirmed and pushed to the dark store’s management platform within milliseconds.
The order priority queue:
Orders enter a priority queue sorted by:
| Priority Factor | Logic |
| Order time | Older orders served first (FIFO within the same slot) |
| Delivery slot | Slot-booked orders given priority over ASAP orders during peak |
| Express orders | Premium ASAP orders given highest priority |
| Order complexity | Simple orders (5 items) routed before complex orders (30 items) |
The concurrent order management:
A dark store processing 200 orders per hour cannot afford to process them sequentially. The platform manages concurrent orders, 15 to 20 orders being picked simultaneously by different pickers, without location conflicts (two pickers trying to pick from the same shelf location at the same time).
Why slot management matters:
Without delivery slot management, order volume is unconstrained by delivery capacity. A dark store that can dispatch 50 orders per hour but receives 120 ASAP orders in the same hour creates a cascading delay that destroys the customer promise.
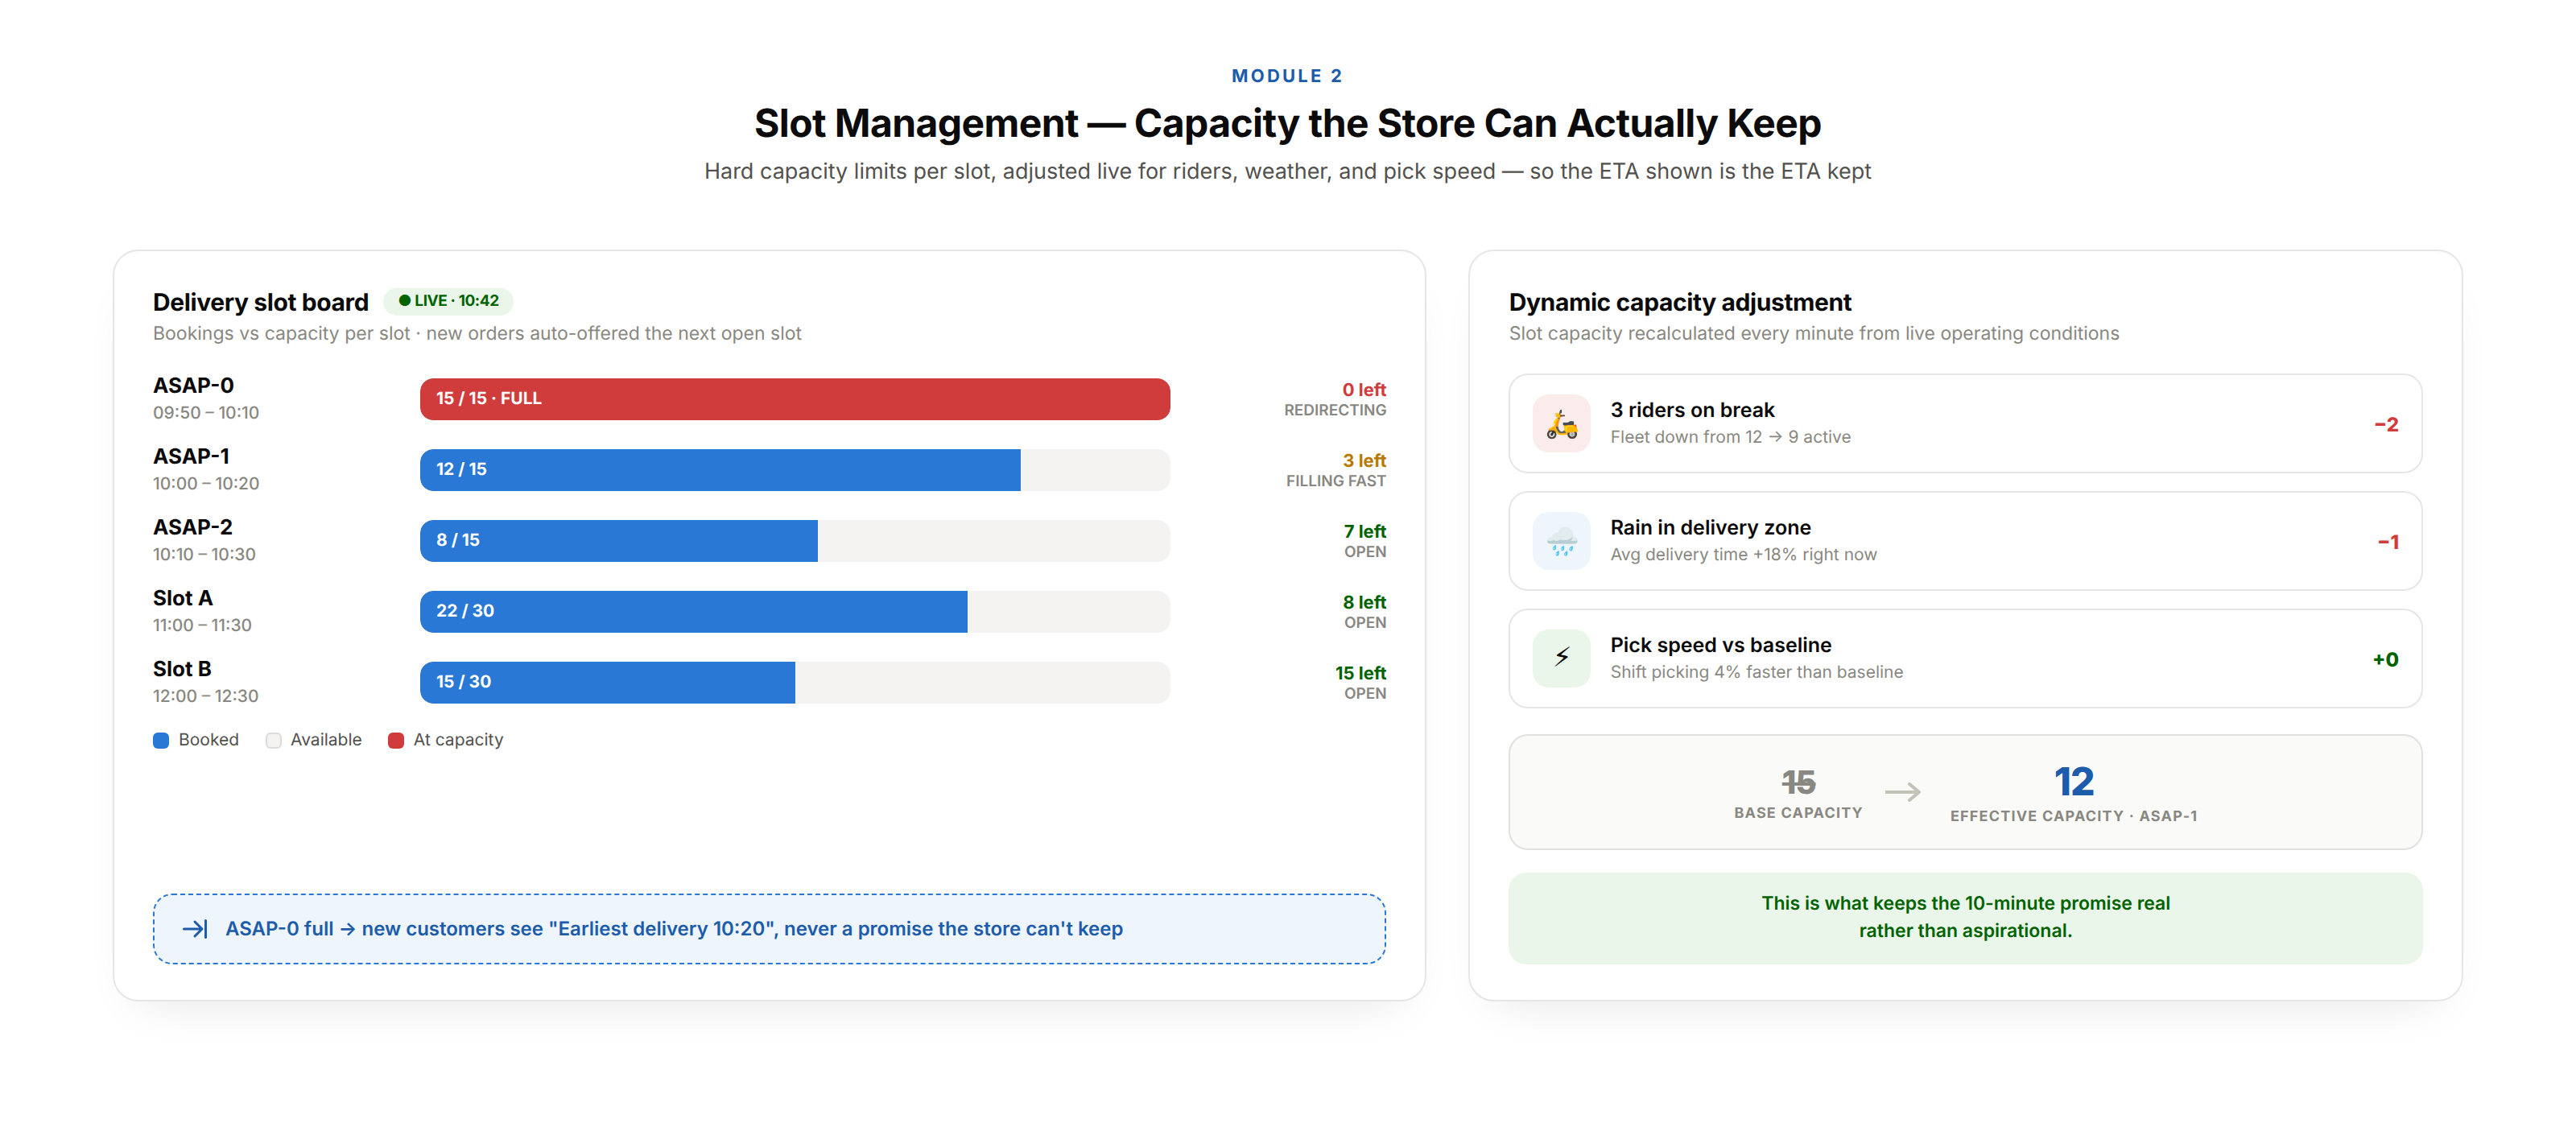
The slot capacity model:
| Slot | Start Time | End Time | Capacity (orders) | Current Bookings | Available |
| ASAP-1 | 10:00 | 10:20 | 15 | 12 | 3 |
| ASAP-2 | 10:10 | 10:30 | 15 | 8 | 7 |
| Slot A | 11:00 | 11:30 | 30 | 22 | 8 |
| Slot B | 12:00 | 12:30 | 30 | 15 | 15 |
When capacity is reached in a slot, new orders are automatically offered the next available slot. The customer sees the earliest available delivery time, not a false promise that cannot be kept.
Dynamic slot capacity:
Slot capacity is not static. It adjusts based on:
Current rider availability, if 3 riders are offline for breaks simultaneously, slot capacity reduces temporarily. Weather conditions, rain increases delivery time, reducing throughput.
Store picking productivity, if the current shift is picking slower than baseline, slot capacity reduces. This dynamic adjustment is what keeps the ASAP delivery promise real rather than aspirational.
The dark store layout for speed:
A dark store’s physical layout is optimised for picking speed, not browsing convenience. Fast-moving SKUs (milk, eggs, bread, bananas) are placed at the front near the packing station. Slow-moving SKUs are at the back. Heavy items are at the bottom. Products that are frequently ordered together are placed adjacent to each other.
The picker app workflow:
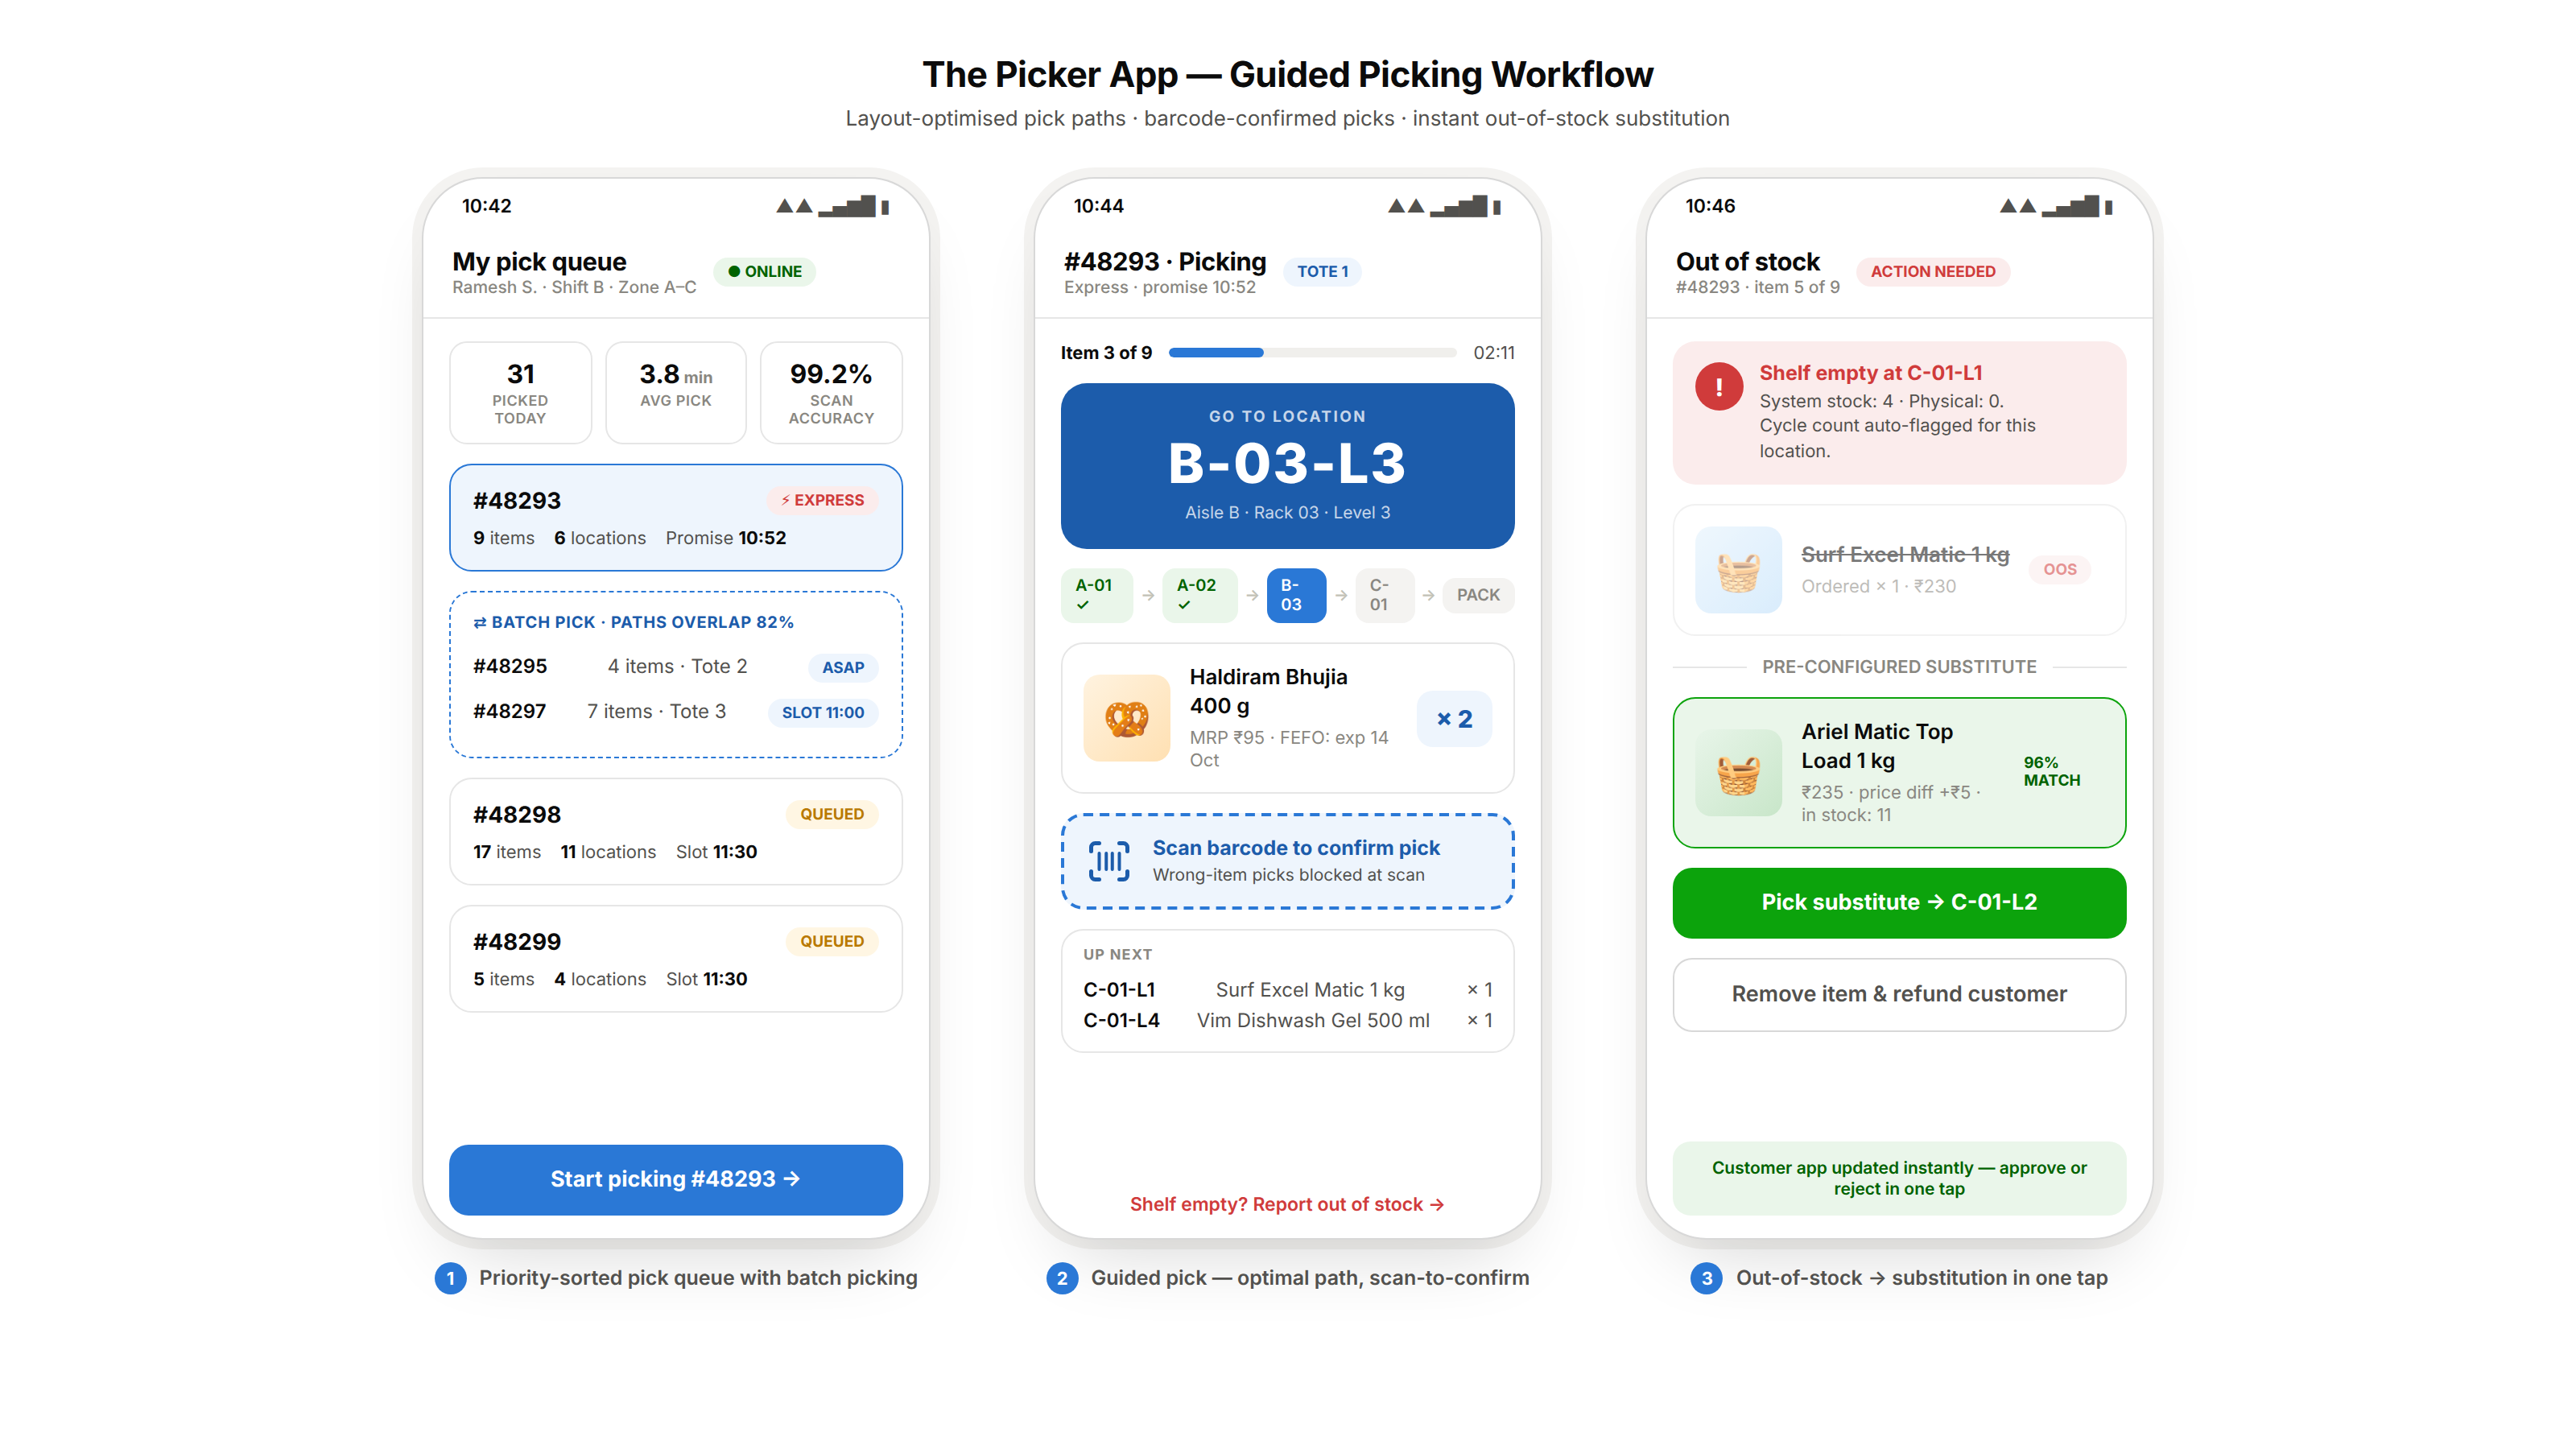
When an order is assigned to a picker, their device shows a picking list optimised for the store’s physical layout:
| Step | Location | Item | Qty | Action |
| 1 | A-01-L1 | Amul Full Cream Milk 500ml | 2 | Scan barcode → confirm |
| 2 | A-02-L2 | Mother Dairy Curd 400g | 1 | Scan → confirm |
| 3 | B-03-L3 | Haldiram Bhujia 400g | 2 | Scan → confirm |
| 4 | C-01-L1 | Surf Excel Matic 1kg | 1 | Scan → confirm |
The picking sequence follows the optimal physical path through the store, not the order in which the customer added items to their cart. Every pick is confirmed with a barcode scan, preventing wrong item picks.
Multi-order picking (batch picking):
A picker can be assigned 2 to 3 orders simultaneously if they are small (< 8 items each) and their pick paths overlap significantly. The picker collects items for all orders in one walk, sorting them into separate totes at each pick location. This increases picker productivity significantly during high-demand periods.
Out-of-stock handling:
When a picker scans an item and the shelf is empty, a discrepancy between system stock and actual stock, the app offers:
Mark as out of stock: The item is removed from the order. The customer is notified and refunded for the item. Suggest substitution: If a substitution has been pre-configured for this SKU, the picker is offered the alternative and confirms or rejects it. The customer’s app shows the substitution immediately.
Real-time inventory in a dark store:
Every pick decrements inventory in real time. Every GRN increments it. The system maintains accurate counts at the individual SKU level, not just category or sub-category. When inventory for any SKU falls below a replenishment threshold, an alert fires immediately.
The replenishment threshold model:
| SKU Type | Replenishment Trigger | Source |
| Fast-moving (e.g., milk) | Falls below 12 hours of stock | Automated purchase order to supplier |
| Medium-moving | Falls below 24 hours of stock | Alert to store manager for manual review |
| Slow-moving | Falls below 3 days of stock | Alert to category manager |
| Promotional item | Falls below promotional demand forecast | Elevated buffer, special handling |
The phantom inventory problem:
Physical inventory and system inventory diverge over time, items fall behind shelves, items are damaged but not recorded, theft occurs. The dark store management platform runs continuous cycle counts, a small number of locations verified every shift, to detect and correct phantom inventory before stockouts surprise pickers.
Waste and damage tracking:
Perishable inventory in a dark store, produce, dairy, baked goods, expires regularly. The platform tracks:
Expiry dates at GRN entry. FEFO (First Expiry, First Out) picking enforcement. Daily waste count, quantities expired or damaged during the shift. Waste as a percentage of received quantity per category, the primary freshness KPI.
The rider allocation logic:
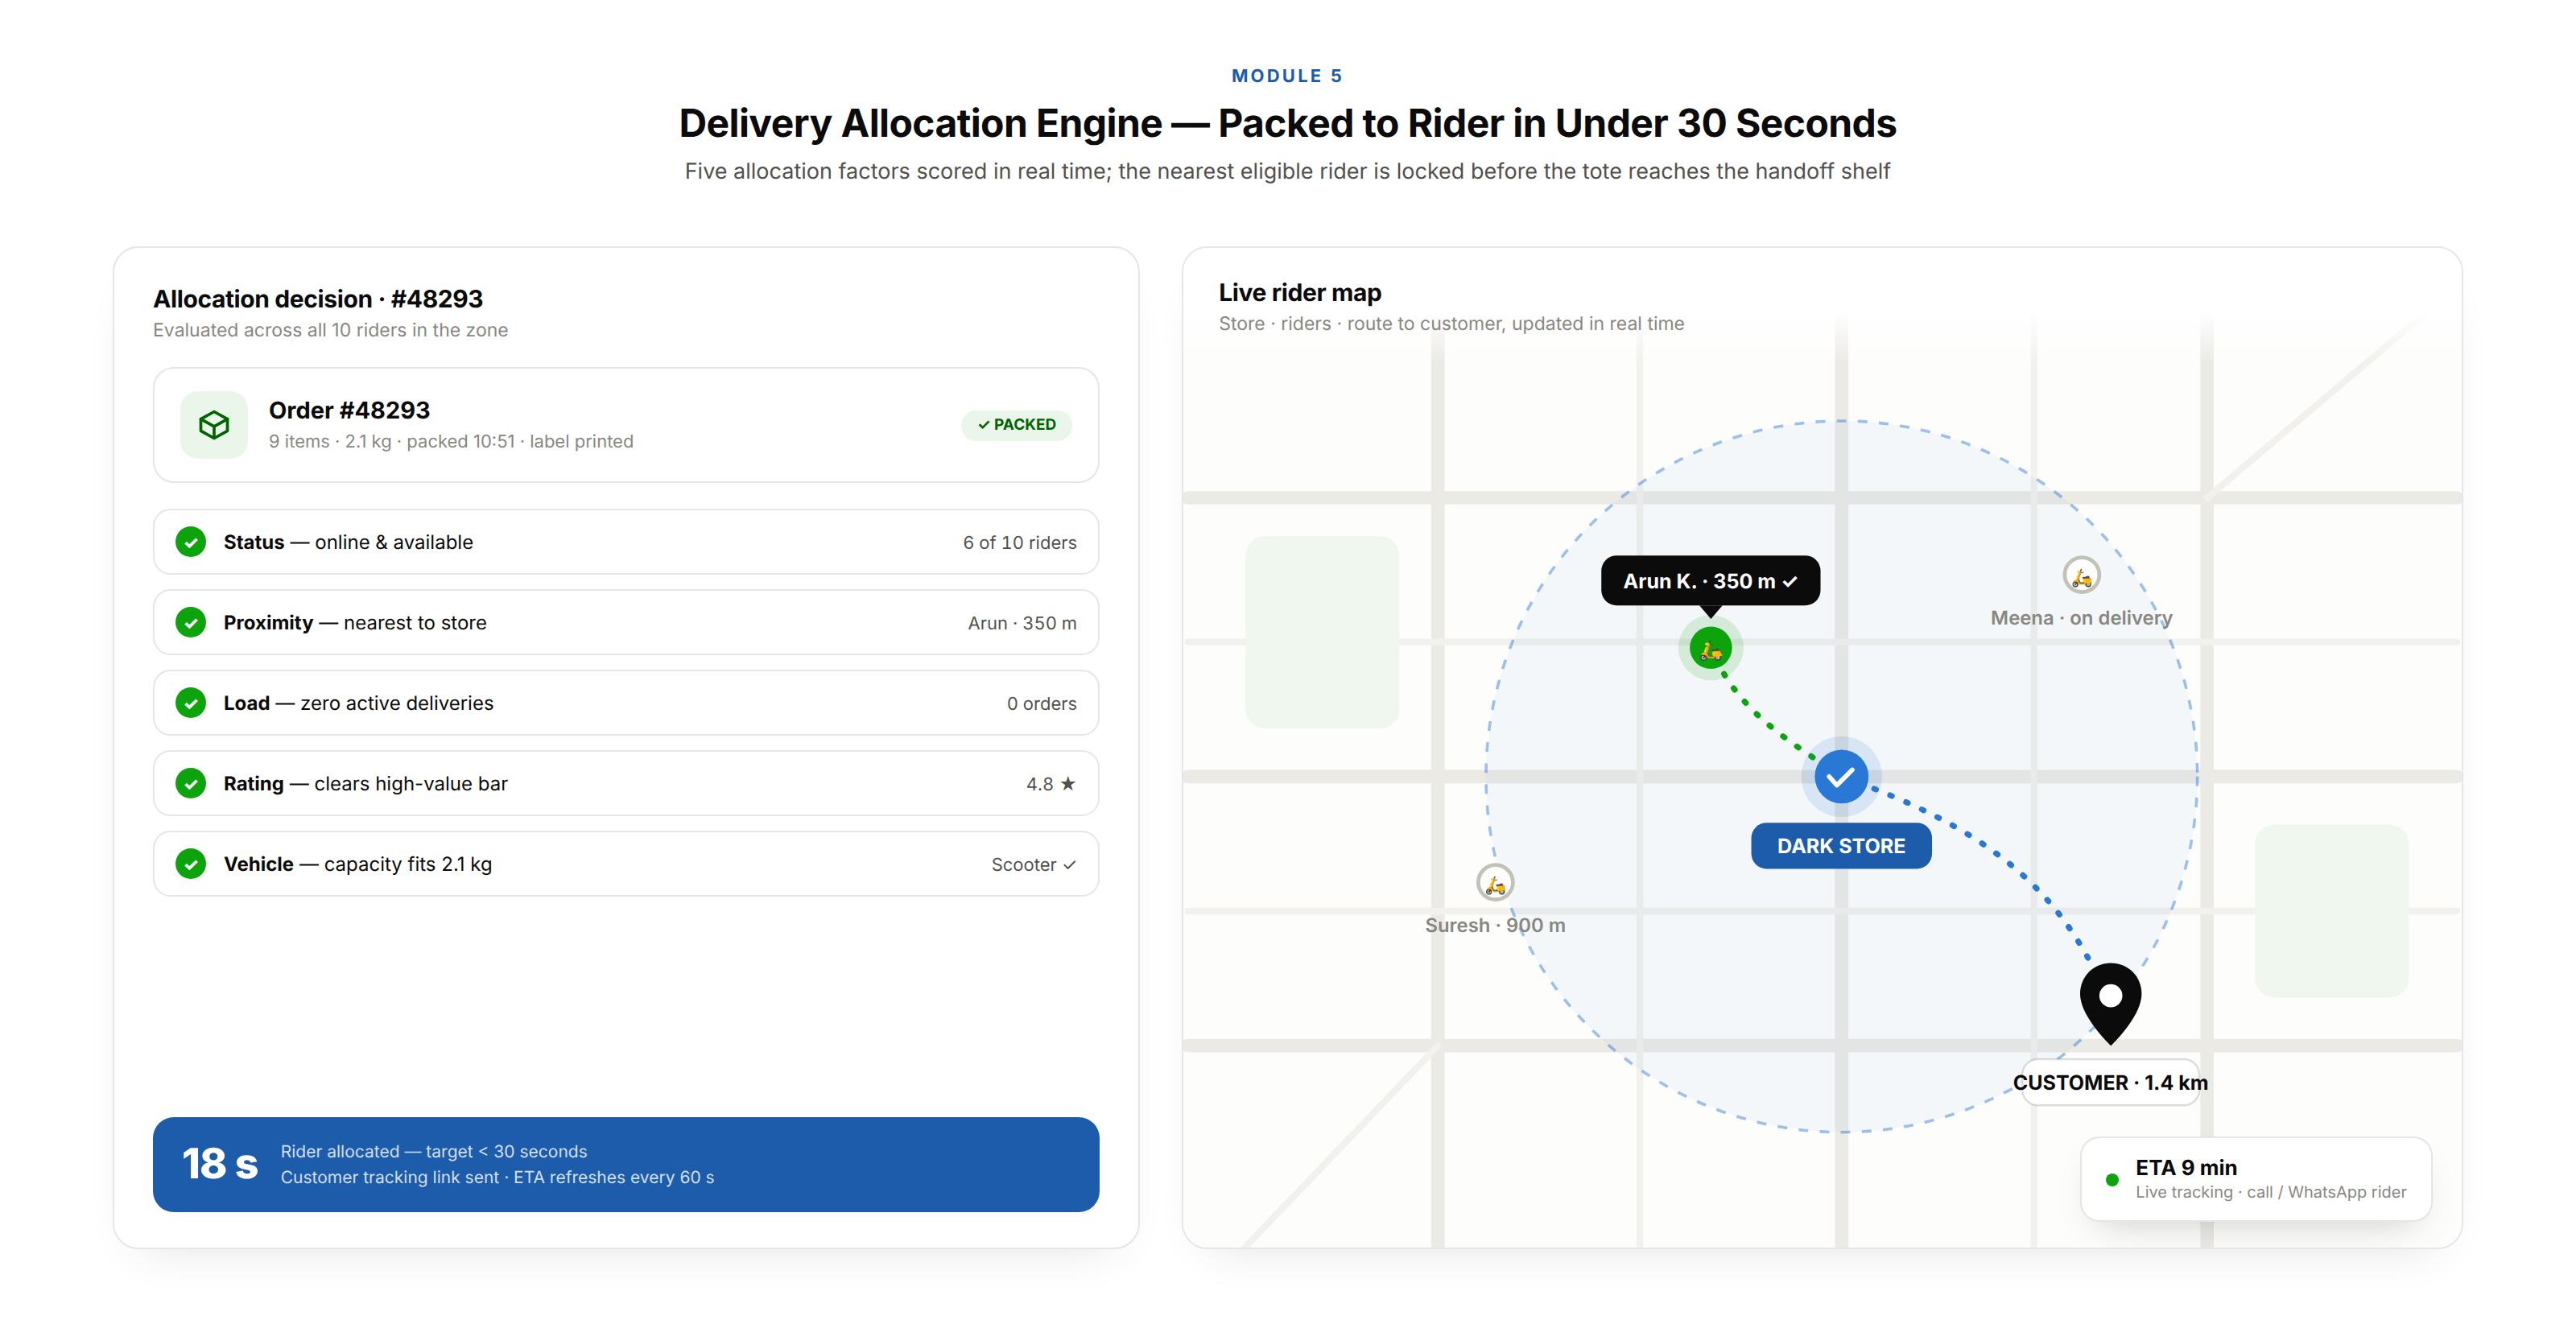
When an order is packed and ready for dispatch, the platform allocates a rider within 30 seconds. The allocation considers:
| Factor | Logic |
| Rider current status | Only available riders considered |
| Rider current location | Nearest rider to the store |
| Rider current order load | Riders with 0 active deliveries preferred |
| Rider rating | Lower-rated riders not allocated for high-value orders |
| Vehicle type | Heavy orders require riders with appropriate vehicle |
Live rider tracking:
Every allocated rider’s location is tracked in real time through the rider app. The store operations team sees every active rider on a live map, which rider is at the store, which is en route to a customer, which has completed and is returning, and which is offline.
This visibility enables proactive management, when delivery times are trending above SLA, the store manager can request additional rider allocation from the fleet management system.
The customer delivery experience:
Once the rider is allocated, the customer receives: Real-time tracking link, rider’s live location on a map. ETA, estimated arrival time updated every 60 seconds. Contact option, call or WhatsApp the rider directly. Delivery confirmation, notification when the rider arrives and when the order is delivered.
The real-time operations view:
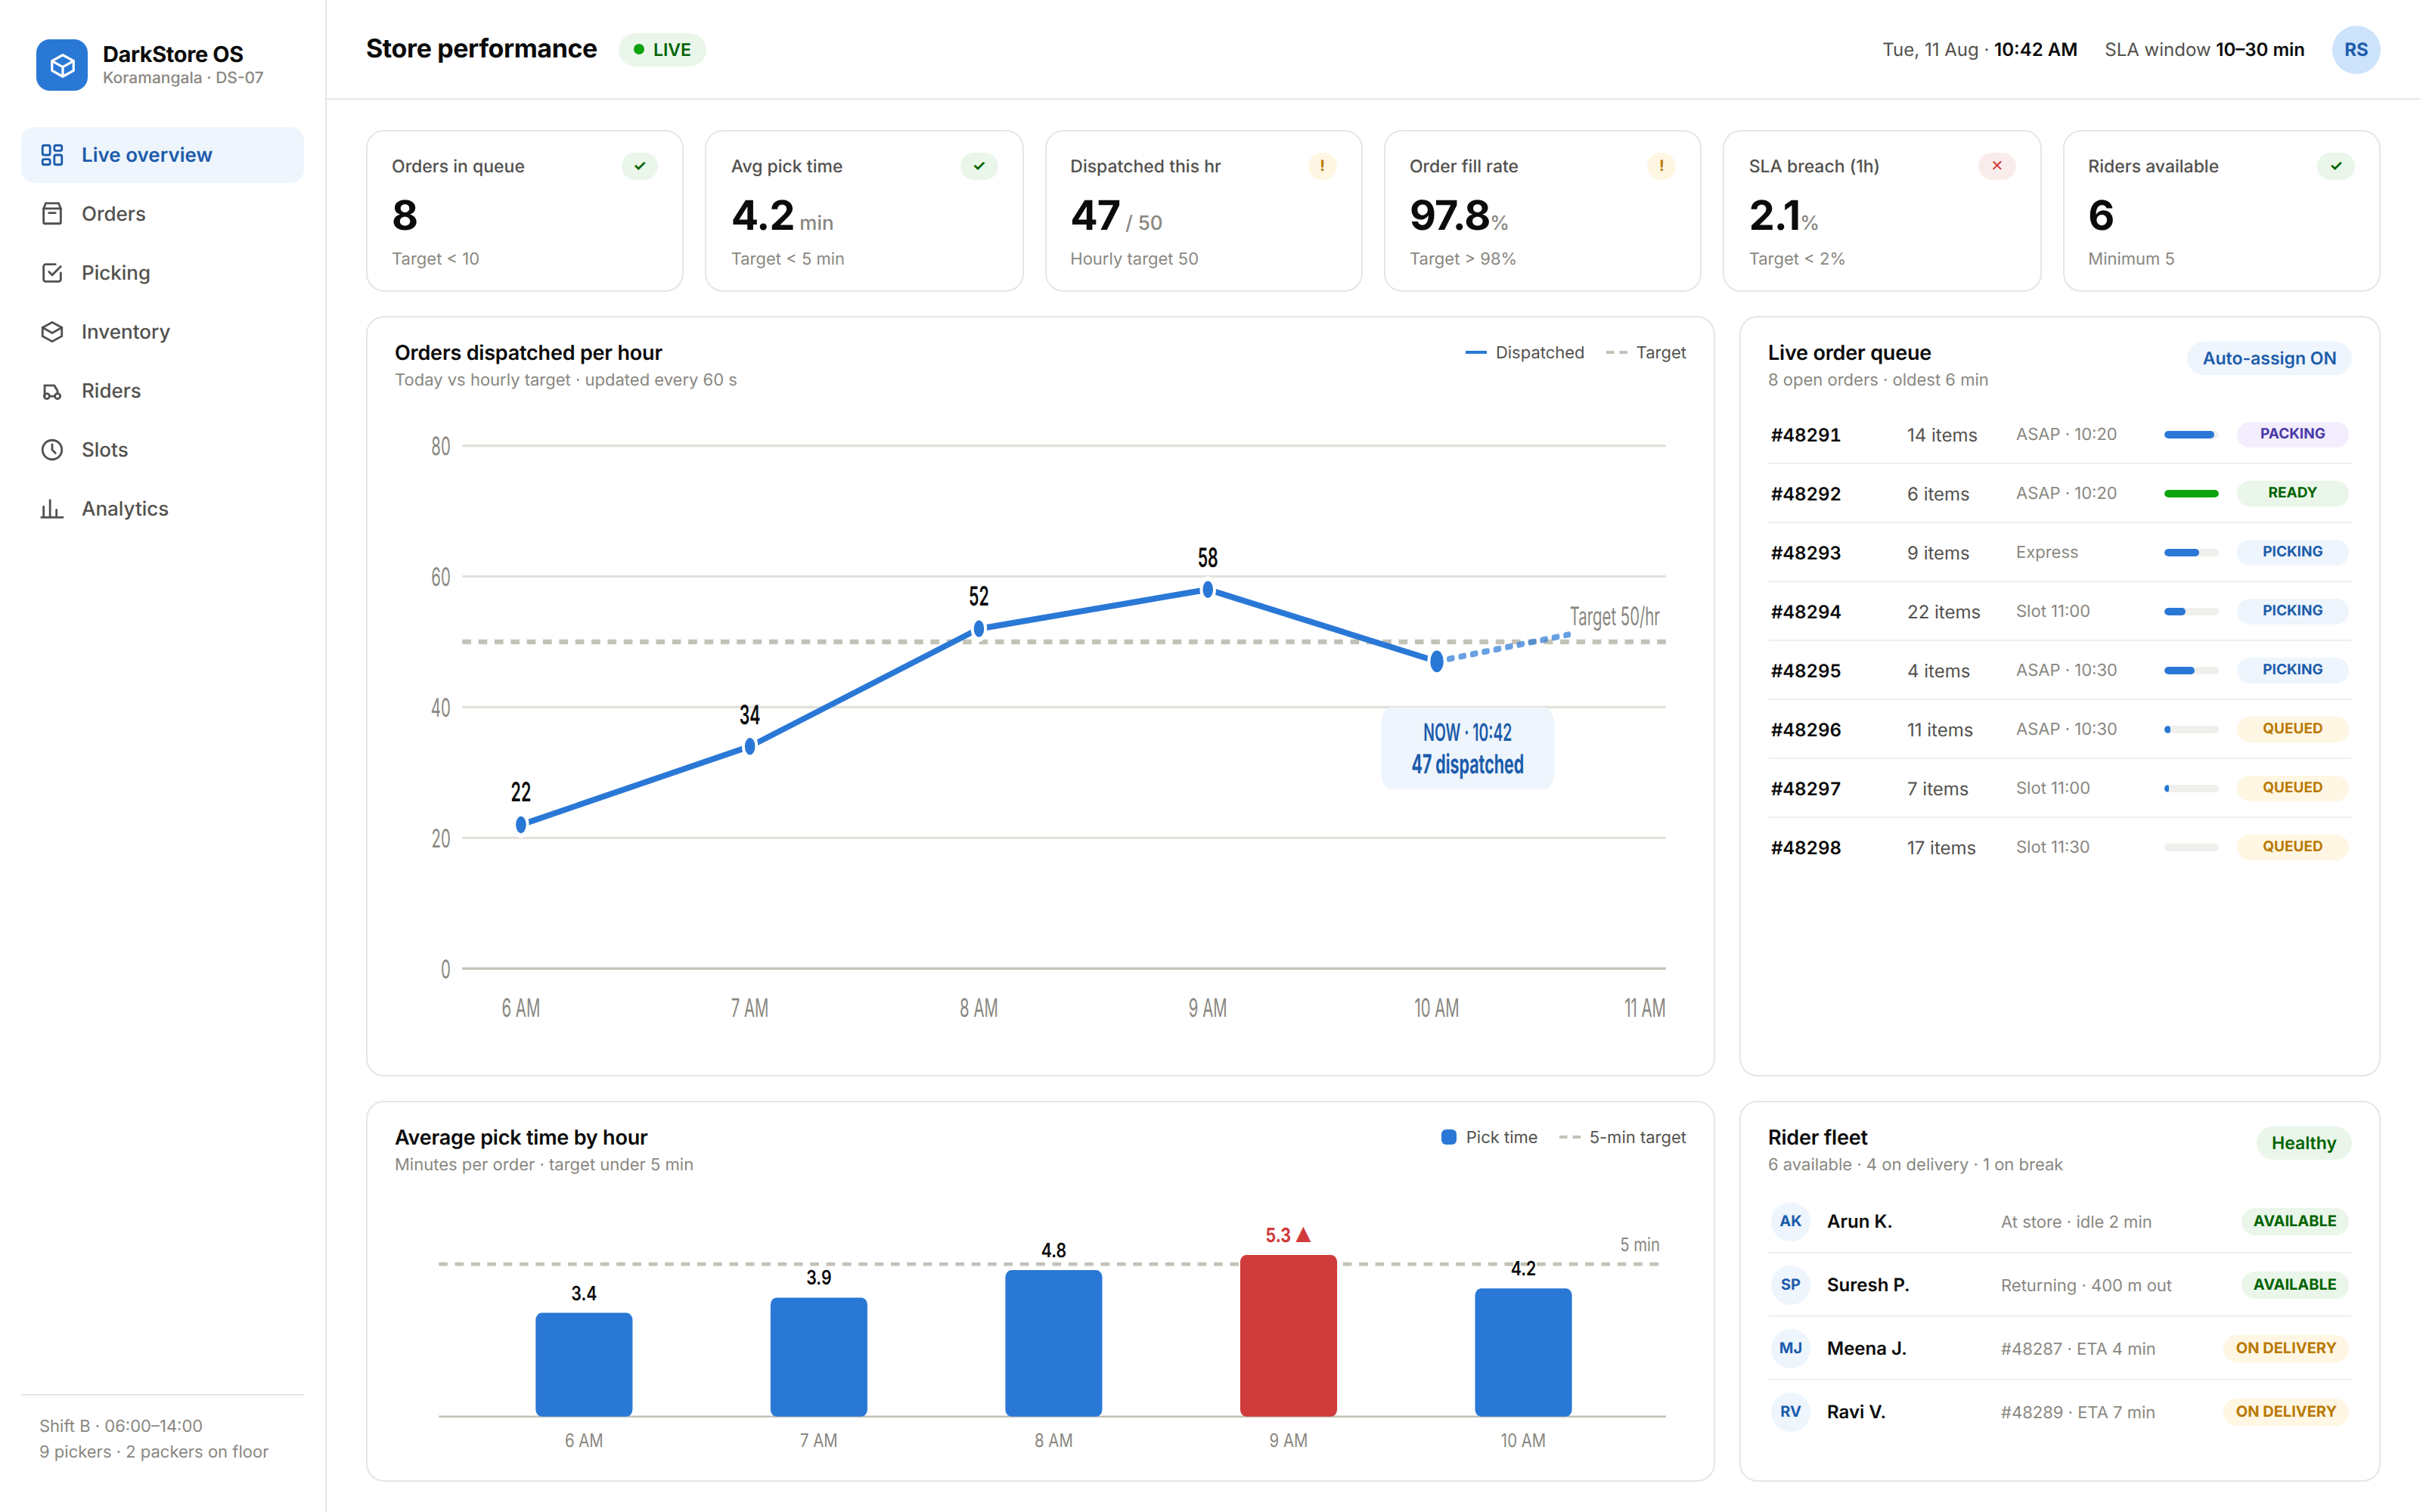
The store manager sees a live dashboard showing the store’s performance against its SLA commitments at every moment:
| Metric | Current Value | Target | Status |
| Orders in queue | 8 | < 10 | ✅ Green |
| Average pick time | 4.2 minutes | < 5 minutes | ✅ Green |
| Orders dispatched this hour | 47 | 50 target | 🟡 Yellow |
| OFR (Order Fill Rate) | 97.8% | > 98% | 🟡 Yellow |
| SLA breach rate (last hour) | 2.1% | < 2% | 🔴 Red |
| Riders available | 6 | ≥ 5 | ✅ Green |
Key dark store metrics:
| Metric | Definition | Best-in-class |
| Average pick time | Time from order assigned to picker to order ready | < 4 minutes |
| OFR (Order Fill Rate) | Items delivered / items ordered | > 98% |
| On-time delivery rate | Orders delivered within promised window | > 95% |
| Orders per picker per hour | Picker productivity | 12–18 orders |
| Inventory accuracy | System stock vs physical count | > 99% |
| Waste as % of perishable GRN | Freshness metric | < 3% |
| Module | Cost Range (USD) | Notes |
| Order intake + priority queue | $6K – $12K | Real-time OMS integration |
| Slot management + dynamic capacity | $6K – $12K | |
| Picker app (Android, Zebra or consumer device) | $10K – $18K | Barcode scan, multi-order picking |
| Guided picking + path optimisation | $6K – $12K | Layout-optimised sequence |
| Live inventory + replenishment alerts | $8K – $15K | Real-time decrements, cycle count |
| Out-of-stock + substitution management | $4K – $8K | |
| Packing station + label generation | $4K – $8K | |
| Delivery allocation engine | $8K – $15K | Real-time rider assignment |
| Rider tracking integration | $5K – $10K | Live GPS, ETA |
| Store performance dashboard | $6K – $12K | Real-time KPIs |
| Waste and damage tracking | $4K – $8K | |
| Analytics + demand forecasting per store | $5K – $10K | |
| AWS + VAPT + Year 1 ops | $5K – $10K | |
| Total | $77K – $150K | Full dark store platform |
Contact: mayank@engineerbabu.com
A dark store is a small-format fulfilment facility, typically 2,000 to 5,000 square feet, designed exclusively for rapid order picking and dispatch to nearby customers, with no retail customer access. Unlike a traditional warehouse, which is optimised for large-batch order processing and inventory storage efficiency, a dark store is optimised for single-order picking speed, every layout decision, every process, and every technology tool is designed to minimise the time between receiving a customer order and handing it to a delivery rider. Unlike a retail store, a dark store has no checkout counters, no browsing aisles, no customer service counter, just densely packed shelving arranged for picker efficiency, a small packing area, and a handoff point for riders.
Order Fill Rate (OFR) is the percentage of ordered items that are actually delivered to the customer, calculated as items delivered divided by items ordered. If a customer orders 10 items and 9 are delivered (one was out of stock), the OFR for that order is 90%. OFR is the primary quality metric for dark stores because it is the measure of whether the store is delivering on its core promise, that the items shown as available in the app are actually available for delivery. An OFR below 96% erodes customer trust rapidly. Best-in-class quick commerce operations target OFR above 98.5%. The gap between high and low OFR operations is primarily driven by inventory accuracy, a store whose system inventory does not match physical inventory will show items as available when they are not, generating low OFR orders and customer disappointment.
Slot management prevents SLA breaches by making delivery capacity visible and constraining order acceptance to what the store can actually fulfil within the promised time. Without slot management, a dark store receives unconstrained ASAP orders during peak hours, 6pm to 8pm on weekdays, and the accumulated orders exceed what the pickers and riders can process within the 10 to 30 minute promise window. Slot management enforces a hard capacity limit per time slot, when capacity is reached, new orders are automatically redirected to the next available slot. The customer sees an accurate ETA rather than a false 10-minute promise that becomes a 35-minute delivery with an SLA breach notification. Dynamic slot capacity adjustment, reducing slot capacity when rider availability drops or picking speed slows, makes the capacity model responsive to real-time operational conditions rather than static planning assumptions.