How to Build a Wealth Management Platform, Portfolio Management, Goal Planning, Rebalancing, Client Portal 2026


Create engaging, high-performance mobile applications tailored to your business needs. We craft future-ready apps that offer smooth user experiences on all devices.
Build robust and scalable websites and CMS platforms that help you manage content effortlessly. Our development ensures a seamless digital presence.
Launch secure, feature-rich online stores with intuitive shopping experiences. We build tailored eCommerce platforms designed for growth.
Design captivating games with immersive gameplay and stunning graphics. From concept to launch, we build engaging experiences that players love.
Enhance your customer relationships with customized Salesforce implementations. Drive growth and efficiency with smarter CRM solutions.
Harness artificial intelligence and machine learning to automate workflows and gain actionable insights. Our AI transforms data into smart decisions.
Accelerate your software delivery lifecycle with continuous integration, delivery, and infrastructure automation to boost efficiency.
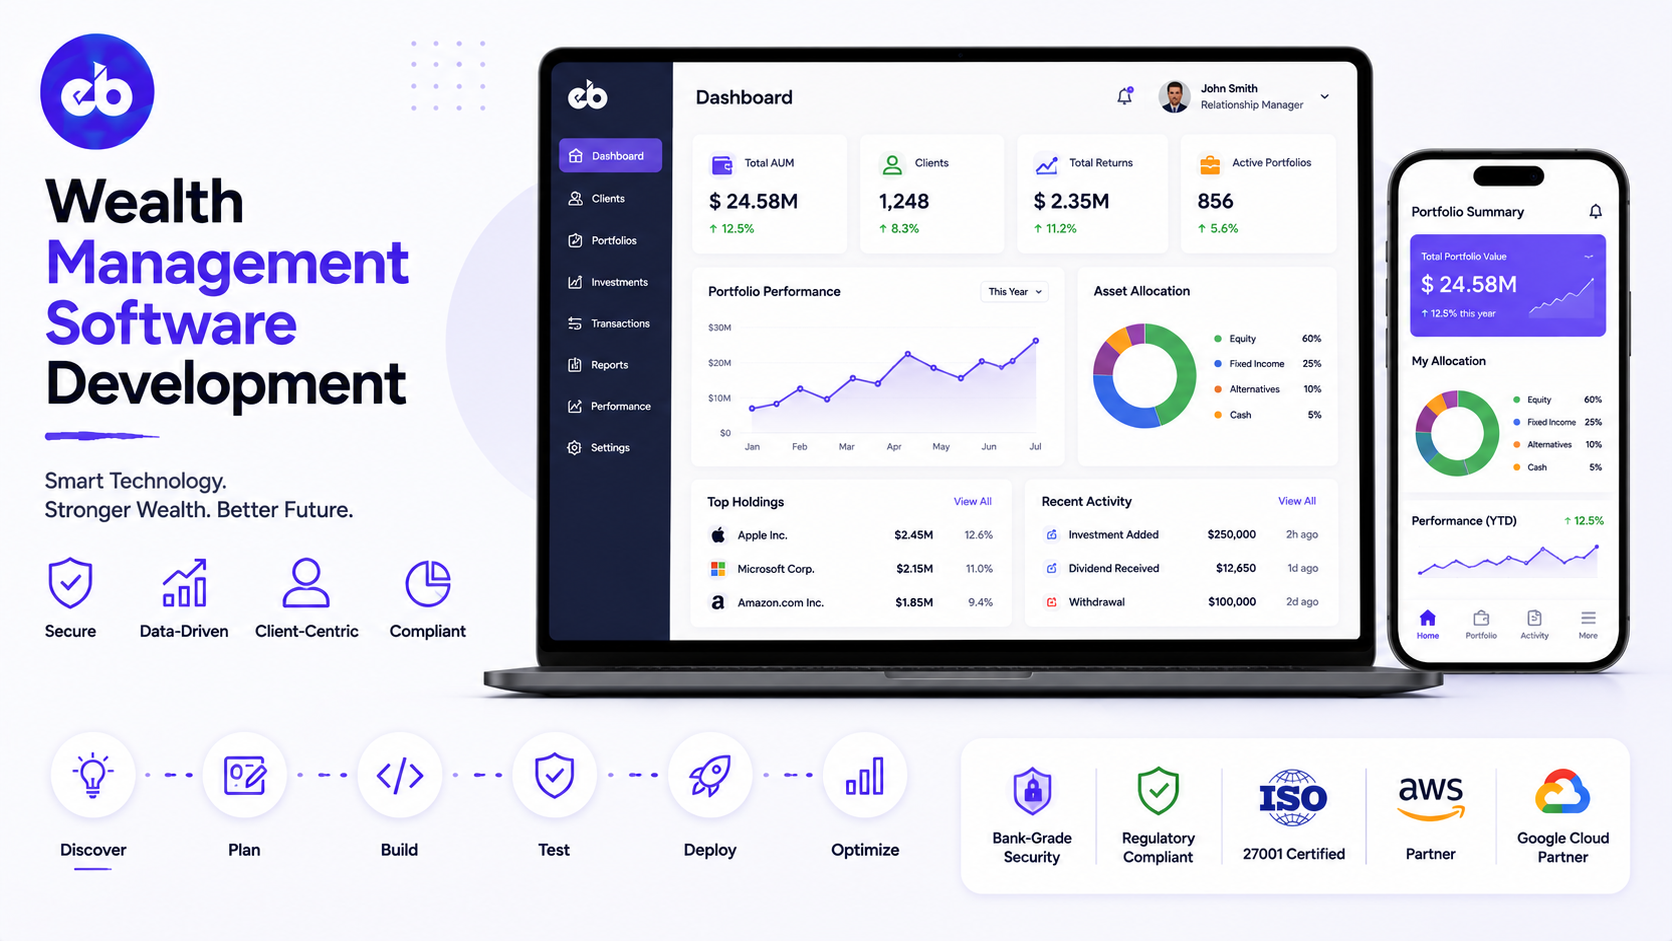
The global wealth management market manages $115 trillion in assets. The technology powering most of it was built in the 1990s, bloated legacy platforms that require 6-month implementation timelines, cannot integrate with modern data sources, and deliver client portals that look like they were designed for Internet Explorer.
The opportunity for a modern wealth management platform is enormous in two directions. In the US, the 14,000 Registered Investment Advisors (RIAs) managing $10M to $500M in AUM are underserved by both enterprise platforms (too expensive, too complex) and consumer robo-advisors (too limited for HNW clients).
In India, the $2.7 trillion domestic wealth management market is digitising rapidly, SEBI’s RIA framework, Account Aggregator infrastructure, and MF Central are creating the data plumbing for a genuinely digital advice model.
This guide covers how to build a wealth management platform, from client onboarding and risk profiling through portfolio construction, performance reporting, automated rebalancing, and the financial planning tools that keep HNW clients engaged for decades.
EngineerBabu built financial platforms for EarlySalary/Fibe and technology for 75+ YC-backed companies globally. CMMI Level 5. Google AI Accelerator 2024 Top 20. Contact: mayank@engineerbabu.com
| Function | Module |
| Client onboarding | KYC, risk profiling, investment policy statement |
| Account aggregation | Fetch all client assets across institutions |
| Investment management | Holdings, transactions, asset allocation |
| Financial planning | Goal-based planning, cash flow, retirement projection |
| Investment research | Market data, analyst reports, model portfolios |
| Trade execution | Order management, broker integration |
| Automated rebalancing | Drift monitoring, rebalancing triggers, execution |
| Performance reporting | Returns, attribution, benchmark comparison |
| Fee management | AUM-based, retainer, transaction fee calculation |
| Client portal | Self-service dashboard, document vault, secure messaging |
| Compliance | SEBI/SEC regulation, suitability documentation |
| CRM | Client relationships, task management, communication |
The onboarding workflow:
| Step | Action | System |
| Prospect enquiry | New client expresses interest | CRM lead record created |
| KYC collection | PAN, Aadhaar, address proof, bank account | Document upload + NSDL/KRA API verification |
| Risk profiling | Investment knowledge, time horizon, loss tolerance questionnaire | Risk scoring engine |
| Investment Policy Statement | Formal document defining client’s investment guidelines | IPS generation from risk profile + goals |
| Account setup | Investment accounts opened at linked custodians/AMCs | Account linking API |
| Initial funding | Client transfers initial investment | Bank mandate, payment gateway |
The risk profiling questionnaire:
The risk profiling engine uses a psychometric questionnaire, 15 to 20 questions covering financial knowledge, investment experience, time horizon, income stability, liquidity needs, and emotional response to market losses.
The scoring model weights these dimensions and produces a risk score that maps to an investment profile:
| Risk Score | Profile | Typical Asset Allocation |
| 0–20 | Conservative | 80% debt, 20% equity |
| 21–40 | Moderate conservative | 60% debt, 40% equity |
| 41–60 | Moderate | 40% debt, 60% equity |
| 61–80 | Moderate aggressive | 20% debt, 80% equity |
| 81–100 | Aggressive | 5% debt, 95% equity |
The risk profile drives the model portfolio assigned to the client and the suitability documentation that must be maintained for regulatory compliance.
The aggregation sources (India):
| Source | Data | Integration |
| Account Aggregator (AA) framework | Bank accounts, fixed deposits, insurance, NPS | AA API (with customer consent) |
| MF Central / CAMS / KFintech | Mutual fund holdings across all AMCs | CAMS/KFintech consolidated statement API |
| Depository (NSDL/CDSL) | Equity, debt, ETF holdings in demat account | CDAS API / NSDL API |
| NPS | National Pension System balance and allocation | NPS CRA API |
| EPF | Employee Provident Fund balance | EPFO API |
| Direct bond platforms | Bonds held on platforms like Bondsindia | Platform API |
| Manual entry | Real estate, gold, unlisted equity, foreign assets | Client self-declaration |
The consolidated net worth view:
The platform aggregates all linked accounts into a single consolidated portfolio view, showing the client’s complete financial picture: total assets by class, total liabilities, net worth, and asset allocation across equity, debt, real estate, alternatives, and cash.
This consolidated view is the most compelling feature for clients, seeing all their assets in one place, updated daily, is something no traditional wealth manager has ever been able to provide without significant manual effort.
The financial planning engine:
Goal-based planning defines specific financial objectives, a child’s education in 15 years, retirement at 60, a house purchase in 7 years, and works backward to determine how much to invest, in what assets, to meet each goal with a defined probability of success.
Goal types and inputs:
| Goal Type | Key Inputs | Output |
| Child’s education | Current age, target age, current education cost, inflation assumption | Monthly SIP required, recommended asset allocation |
| Retirement | Current age, retirement age, current expenses, inflation, longevity | Corpus required, monthly savings required, drawdown strategy |
| Home purchase | Target property value, down payment %, timeline | Monthly savings required, loan affordability |
| Wealth creation | Target corpus, timeline, risk tolerance | Monthly investment required, asset allocation |
| Emergency fund | Monthly expenses, months of cover required | Target amount, liquid instrument recommendation |
Monte Carlo simulation:
For retirement planning and long-term wealth creation goals, the platform runs Monte Carlo simulations, thousands of random market return scenarios based on historical return distributions and correlations, to calculate the probability of achieving the goal with the current savings rate and asset allocation.
A client’s retirement plan with a 70% probability of success may need a higher savings rate or a more aggressive allocation to reach 90% probability. The simulation makes this trade-off visible and actionable.
The model portfolio library:
The wealth manager defines a set of model portfolios, standardised asset allocations mapped to risk profiles. Each model portfolio specifies:
| Element | Details |
| Asset allocation | Equity %, debt %, alternatives %, within each asset class, sub-allocation by category |
| Instruments | Specific mutual funds, ETFs, or categories recommended |
| Rebalancing bands | Tolerance bands before rebalancing is triggered |
| Benchmark | The index or blended benchmark the portfolio is measured against |
| Risk rating | Model portfolio’s risk rating, matches client risk profiles |
Factor-based portfolio construction:
For more sophisticated wealth managers, the platform supports factor-based portfolio construction, building equity allocations with explicit factor tilts (value, quality, low volatility, momentum) based on the client’s view of market conditions and the expected factor premia.
The drift monitoring engine:
Every portfolio is monitored daily against its target asset allocation. When an asset class drifts beyond its tolerance band, typically ±5% for the primary asset allocation, a rebalancing event is triggered.
Rebalancing calculation:
| Asset Class | Target | Current | Drift | Rebalancing Action |
| Indian Large Cap Equity | 40% | 47% | +7% | Sell ₹2.1L |
| Indian Mid Cap Equity | 20% | 18% | -2% | No action (within band) |
| International Equity | 10% | 9% | -1% | No action |
| Debt, Short Duration | 20% | 17% | -3% | Buy ₹0.9L |
| Debt, Dynamic Bond | 10% | 9% | -1% | No action |
Tax-efficient rebalancing:
The rebalancing engine considers tax implications before executing. Long-term capital gains on equity held for more than 1 year are taxed at 12.5% above ₹1.25 lakh annually (India, 2026). The engine:
Prioritises rebalancing through new inflows rather than selling existing holdings. Selects lots with long-term gains over short-term gains when selling is necessary. Identifies tax-loss harvesting opportunities, selling assets with unrealised losses to offset realised gains.
Execution:
After the rebalancing calculation is reviewed and approved, by the advisor, or automatically if within defined parameters, the platform generates buy/sell orders and routes them to the appropriate execution channel: mutual fund platform APIs for MF units, broker API for direct equity and ETFs.
What the performance report must show:
| Metric | Calculation | Frequency |
| Absolute return | (Current value − invested) / invested × 100 | Real-time |
| Time-weighted return (TWR) | Eliminates cash flow timing distortion | Monthly report |
| Money-weighted return (MWR/IRR) | Client’s actual experience including timing of flows | Quarterly |
| Benchmark comparison | Portfolio return vs relevant benchmark | Monthly |
| Asset class attribution | Which assets contributed how much to return | Quarterly |
| Risk metrics | Standard deviation, Sharpe ratio, max drawdown | Quarterly |
| Goal progress | How much of each goal has been funded | Monthly |
| Fee summary | Total fees paid in the period | Quarterly |
The client report format:
The quarterly report is delivered as a branded PDF, the wealth manager’s logo, colour scheme, and voice, that tells a clear story: here is how your portfolio performed, here is why, here is where you stand on each goal, and here is what we recommend for the next quarter.
The narrative is AI-generated from the performance data and personalised to the client’s specific situation.
| Module | Cost Range (USD) | Notes |
| Client onboarding + KYC + risk profiling | $8K – $15K | AA API, NSDL/KRA, risk scoring |
| Account aggregation (AA + CAMS + NSDL) | $10K – $18K | Multi-source consolidation |
| Goal-based financial planning + Monte Carlo | $10K – $18K | Simulation engine |
| Portfolio management + holdings tracking | $8K – $15K | Real-time portfolio view |
| Model portfolio library + construction | $6K – $12K | |
| Automated rebalancing + tax optimisation | $10K – $18K | Drift monitoring, tax-efficient execution |
| Trade execution + broker integration | $8K – $15K | |
| Performance reporting + client reports | $8K – $15K | PDF generation, attribution |
| Fee calculation + billing | $5K – $10K | AUM-based, retainer, transaction |
| Client portal (web development + mobile app) | $8K – $15K | |
| CRM + task management | $5K – $10K | |
| Compliance documentation + audit trail | $5K – $10K | SEBI/SEC suitability |
| AWS + VAPT + Year 1 ops | $5K – $10K | |
| Total | $96K – $181K | Full wealth management platform |
Contact: mayank@engineerbabu.com
Traditional portfolio management focuses on maximising returns within a defined risk tolerance, the client has a portfolio and the manager tries to make it grow as fast as possible given the risk parameters. Goal-based wealth management defines specific financial objectives, retirement at 60 with ₹5 crore corpus, child’s IIT education in 12 years, home purchase in 5 years, and structures the portfolio to maximise the probability of achieving each goal by its target date. The key difference is the measurement framework: in traditional management, success is outperforming the benchmark. In goal-based management, success is the client achieving their life goals. This shifts the conversation from market returns to life outcomes, which is why goal-based clients have significantly higher retention rates and willingness to stay invested through market downturns.
Time-weighted return (TWR) measures the growth rate of a portfolio by eliminating the effect of cash flows, deposits and withdrawals, that are outside the portfolio manager’s control. It calculates the return during each sub-period between cash flows and chains these sub-period returns together. If a client happened to make a large deposit just before the market fell, TWR shows the portfolio’s actual investment performance independent of that timing. Money-weighted return (MWR or IRR), by contrast, includes the impact of cash flow timing, it shows the client’s actual personal experience with the investment. TWR is the standard for evaluating and comparing manager skill because it isolates investment decisions from cash flow decisions. MWR is more relevant for the client understanding their personal outcome.
Tax-loss harvesting is the practice of selling investments that have declined in value to realise capital losses that can offset taxable capital gains from other investments, reducing the investor’s overall tax liability. An automated platform implements it by monitoring every holding’s unrealised gain or loss continuously. When a holding shows a significant unrealised loss and the investor has realised gains that can be offset, the platform identifies the tax-loss harvesting opportunity, calculates the tax saving, and proposes selling the losing position and reinvesting in a similar (but not identical) position to maintain the portfolio’s target allocation without violating wash-sale rules. The platform handles the wash-sale compliance check automatically, ensuring the sold position is not repurchased within 30 days before or after the sale. At scale, tax-loss harvesting can save investors 0.5 to 1.5% of portfolio value annually in reduced tax liability.